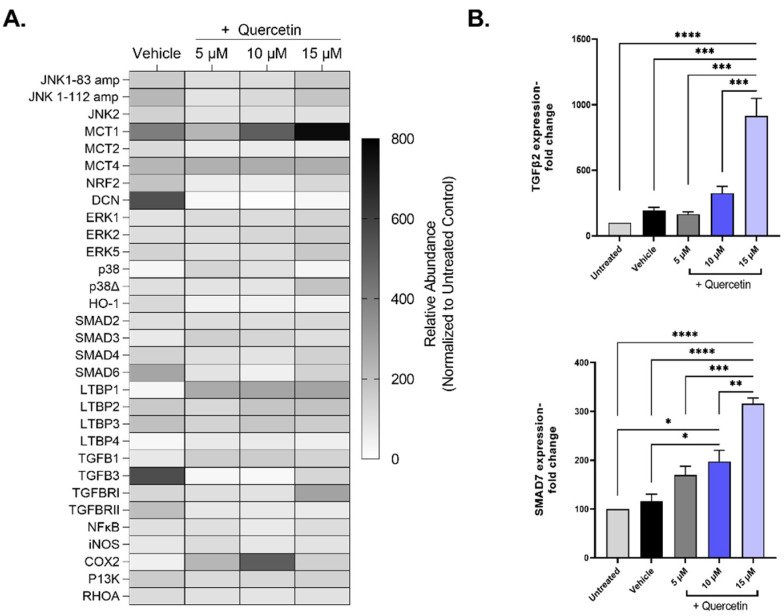
Figure 6.
Expression of select mRNA transcripts by primary human corneal fibroblasts in 3D constructs treated with increasing concentrations of quercetin compared to untreated and vehicle-treated cultures. (A) Heat map of relative gene expression detected using qRT-PCR analysis. Expression was normalized to the untreated control and presented as a percentage (untreated control set at 100%). (B) Select genes influenced by quercetin treatment: transforming growth factor-β2 (TGFB2) mothers and against decapentaplegic homolog 7 (SMAD7). Statistical significance determined based on an ordinary one-way ANOVA analysis with Šídák’s multiple comparisons test. Bars represent mean ± standard error of the mean with n = 3. * p < 0.05, ** p < 0.01, *** p < 0.005, and **** p < 0.0001.

