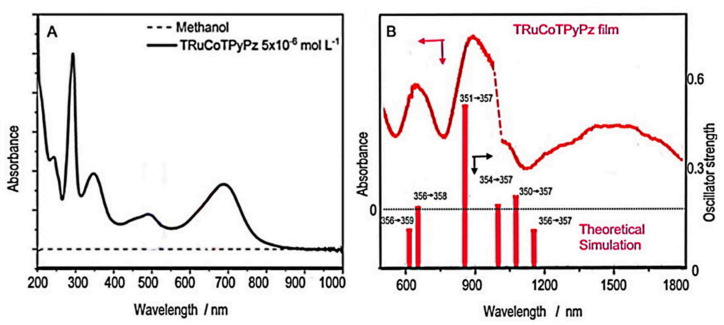
Figure 3.
(A) Electronic spectrum of TRuCo(II)TPyPz in methanol solution, and (B) as molecular film of TRuCo(III)TPyPz onto GCE, including the theoretical bands from ZINDO/S simulation and their corresponding levels. The dotted line in (B) refers to instrumental artifact from the changes in the detector module.

