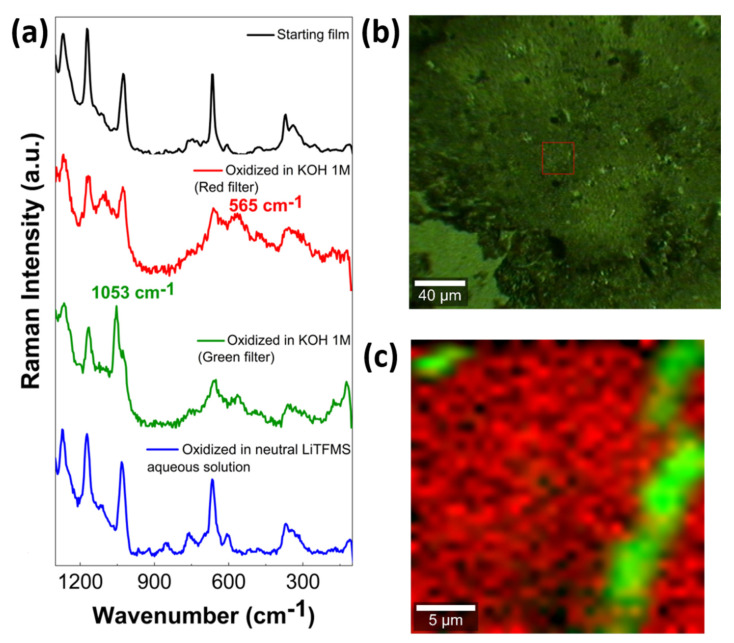
Figure 9.
(a) Raman spectra of TRuCoTPyPz films on FTO electrodes before (black line) and after electrocatalytic oxygen evolution reaction in 1 M KOH in the red and green filters of the Raman mapping. The blue line represents the Raman spectra of the TRuCoTPyPz film oxidized in neutral lithium triflate aqueous solution in the absence of oxygen; (b) optical microscopy image of the TRuCoTPyPz film on FTO glass substrate; (c) Raman spectral mapping of the marked region in (b).

