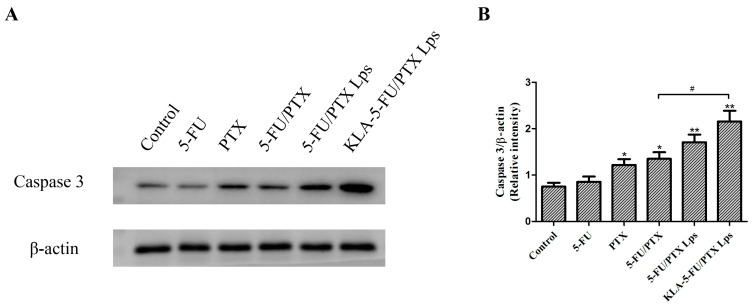
Figure 10.
(A) Western blots of caspase-3. (B) Relative levels of caspase-3, normalized to levels of β-actin. * p < 0.05, ** p < 0.01 vs. control, # p < 0.05. 5-FU, 5-fluorouracil; PTX, paclitaxel; 5-FU/PTX, mechanically mixed free 5-FU and free PTX; 5-FU/PTX Lps, unmodified liposomes co-loaded with 5-FU and PTX; KLA-5-FU/PTX Lps, KLA-modified liposomes co-loaded with 5-FU and PTX.

