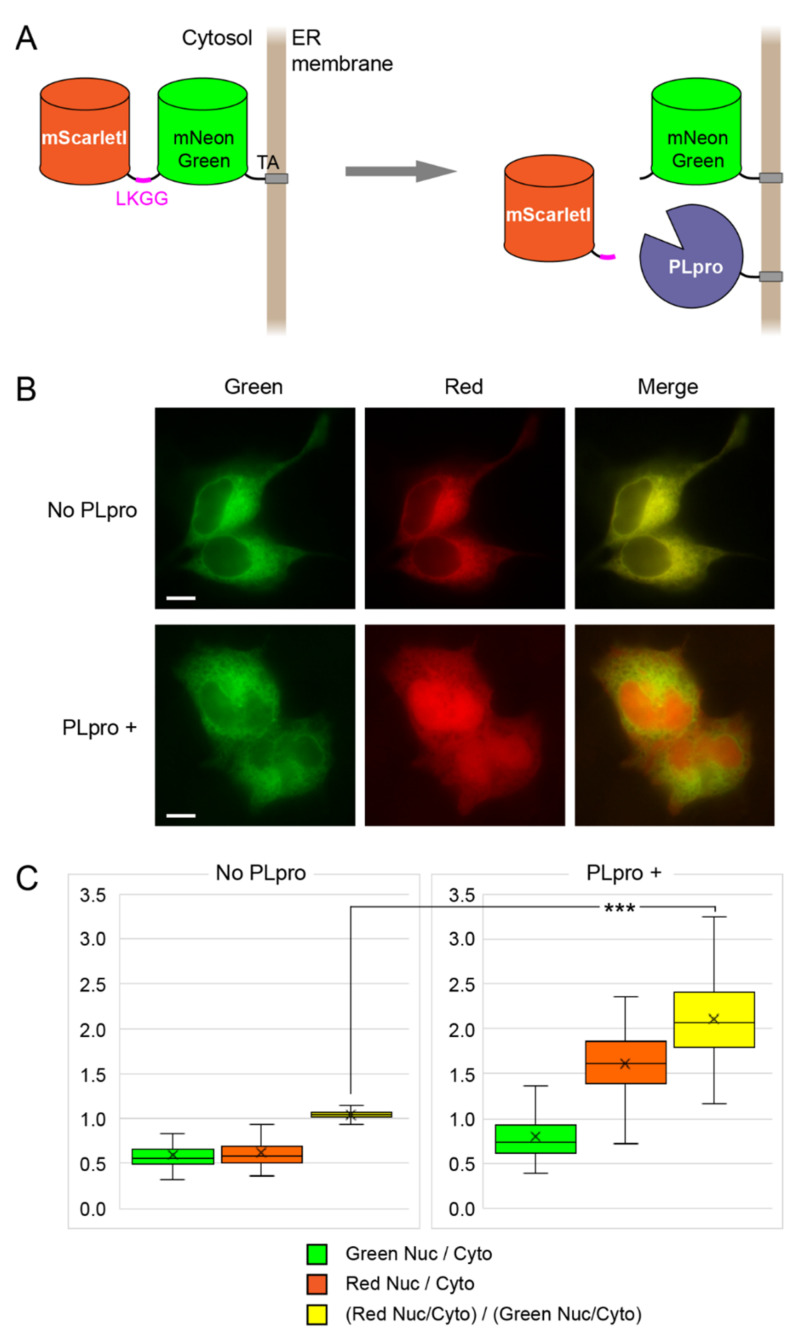
Figure 3.
Translocation sensor of PLpro activity. (A) Scheme of the sensor consisting of the mScarletI and mNeonGreen fluorescent proteins connected by the linker with LKGG recognition site for PLpro and C-terminal TA localization signal. PLpro-TA (with the same ER-bound localization) cleaves the linker and thus liberates mScarletI from the ER surface. (B) Representative examples of cells expressing mScarletI-LKGG-mNeonGreen-TA in the absence (top) or presence (bottom) of PLpro-TA. Images in the green and red channels and their merging are shown. Scale bars: 10 µm. (C) Box and whisker plots for nucleus/cytosol ratios for cells expressing mScarletI-LKGG-mNeonGreen-TA sensor without PLpro (left, n = 190 cells) and in the presence of PLpro (right, n = 150 cells). Median, mean, 1st, and 3rd quartiles as well as minimum and maximum values are shown for each plot. The red and green boxes are the ratio of fluorescence in the nucleus to the cytoplasm in the corresponding channels and the yellow plot is the ratio of the obtained values to each other. ***: p-value less than 0.001 (t-test).

