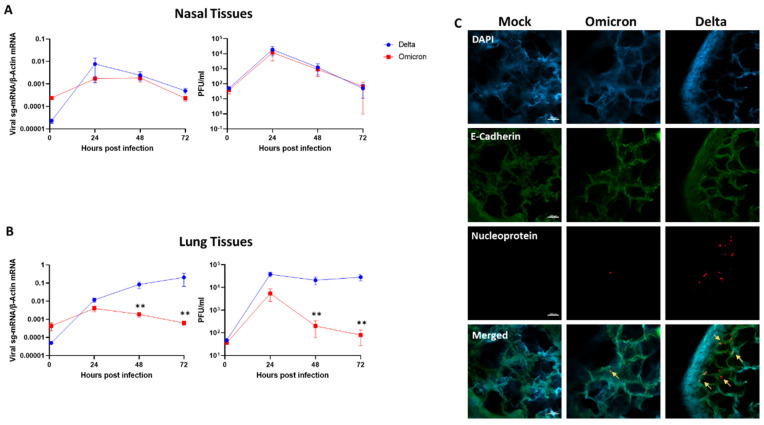
Figure 1.
SARS-CoV-2 Omicron and Delta replication kinetics in human nasal and lung tissues. Nasal (A) and lung (B) organ cultures were (each) infected in parallel with Omicron and Delta (105 PFU/well). The levels of tissue-associated viral sub-genomic (sg)-mRNA (left panels) and infectious virus progeny released from the same infected tissues (right panels) represent mean values (±SEM) of four and five independent nasal and lung tissues, respectively, each tested in four biological replicates. (C) Representative confocal micrographs of whole-mount lung tissues at 72 h post-infection. Whole-mount tissues were visualized using a Nikon A1R confocal microscope and were analyzed using NIS Elements software (Nikon). Scale bar = 100 μm. **, p < 0.01. Statistics were performed using multiple paired, two-tailed Student’s t-test.

