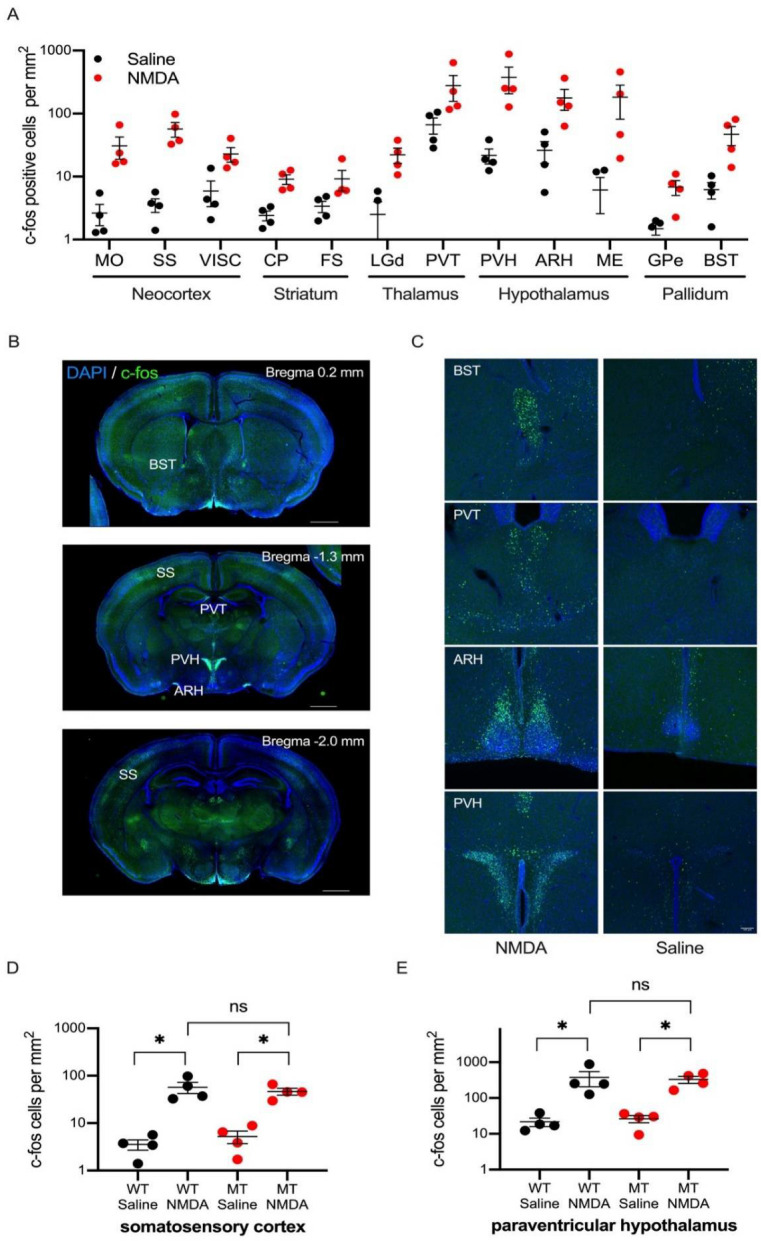
Figure 2.
c-fos expression after NMDA-induced seizure in wild-type mice. (A) Density of c-fos positive neurons across different brain regions in saline- (black) or NMDA- (red) injected mice are depicted in the graph. Brain regions which exhibited a significant increase in the c-fos positive neurons are shown in the graph. Full data is available in Supplementary Table S1. Abbreviations (MO: somatomotor areas, SS: somatosensory areas, VISC: visceral area, CP: caudoputamen, FS: fundus of striatum, LGd: dorsal part of lateral geniculate complex, PVT: paraventricular nucleus of thalamus, PVH: paraventricular hypothalamic nucleus, ARH: arcuate hypothalamic nucleus, ME: median eminence, GPe: globus pallidus, external segment, BST: bed nucleus of stria terminalis). (B) Representative images of c-fos immunostaining in NMDA-injected wild-type mouse brain sections. Scale bar = 1 mm. (C) Representative images of c-fos immunostaining in NMDA- (left) and saline- (right) injected wild-type mouse brain sections. Brain images, including BST, PVT, ARH, and PVH, are shown (from top to bottom). (D) Density of c-fos positive neurons in the somatosensory cortex (SS) in saline- or NMDA-injected wildtype (WT) or SIK1-MT (MT) mice. (E) Density of c-fos positive neurons in the paraventricular hypothalamic nucleus (PVH) in saline- or NMDA-injected wildtype (WT) or SIK1-MT (MT) mice. Data are described in a scatter plot of each value with means ± SEM. Significant differences were detected by ANOVA Bonferroni post hoc test (* p < 0.05; ns, not significant). Scale bar = 1 mm (B) or 100 μm (C).

