Figure 4.
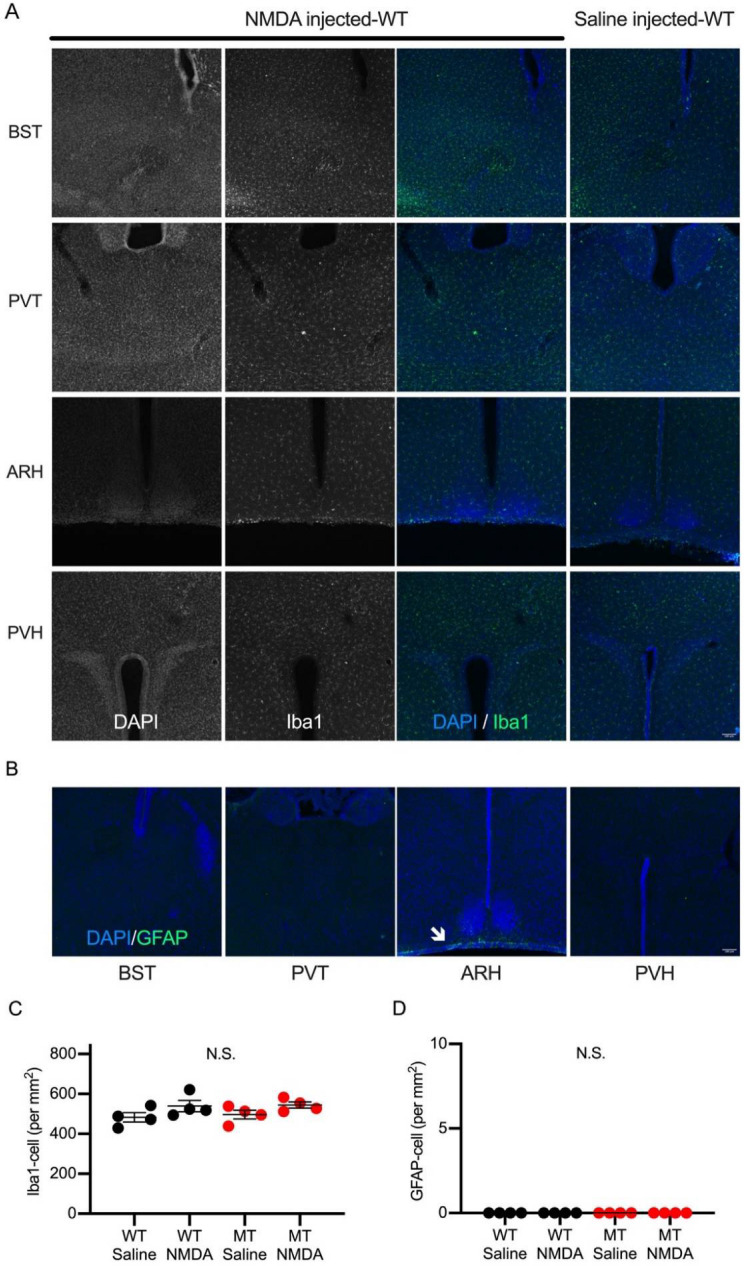
Iba1 and GFAP immunoreactivity in NMDA or saline-injected wild-type mouse brain sections. (A) Confocal images of Iba1 immunopositive microglia on brain regions (from top, BST, PVT, ARH, and PVH) are shown. No significant difference in Iba1 expression patterns were observed between NMDA- (left) and saline- (right) injected mice. Scale bar = 100 μm. (B) Confocal images of GFAP-immunostained brain sections (from left, BST, PVT, ARH, and PVH) in NMDA-injected mice are shown. GFAP signals (arrow) were observed only around the pia mater in the basal part of the hypothalamus. (C) Density of Iba1 positive microglia in PVH was not changed in genotypes or treatments. (D) Density of GFAP positive astrocytes in PVH was not changed in genotypes or treatments. No GFAP signals were observed in either of the mice. Data are described in a scatter plot of each value with means ± SEM. Significant difference was examined by ANOVA Bonferroni post hoc test (N.S., not significant). Scale bar = 100 μm.

