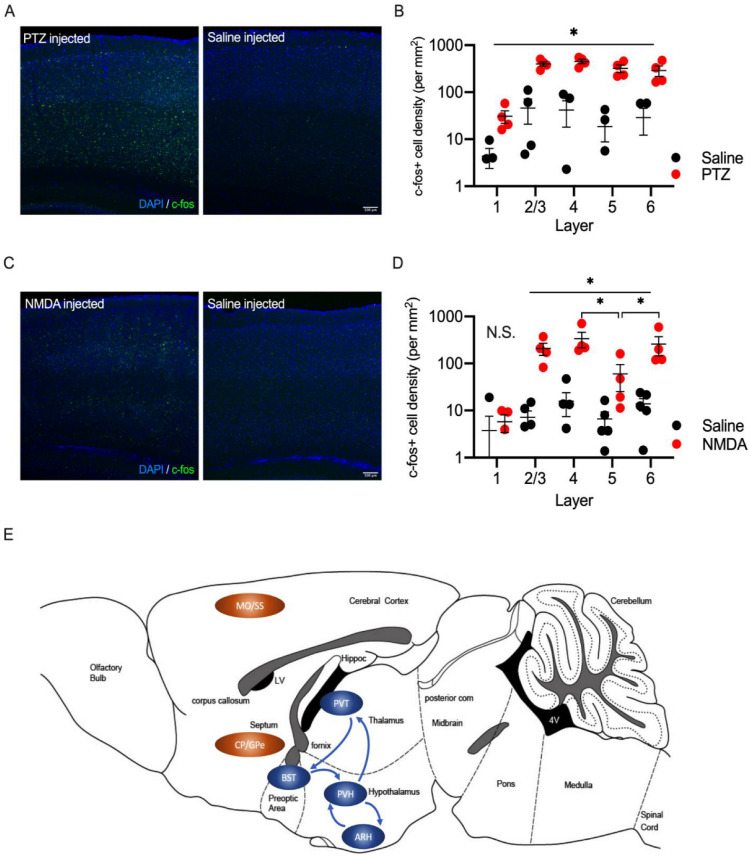
Figure 7.
Laminar distribution of c-fos expression after PTZ or NMDA injection in wild-type mice. (A) Representative images for c-fos (green) immunostaining in the somatosensory region of wild-type mice after PTZ (left) or saline (right) injection. Scale bar = 100 μm. (B) Summary graph for layer distribution of c-fos positive neurons in wild-type mice after PTZ or saline injection. (C) Representative images for c-fos immunostaining in the somatosensory region of wild-type mice after NMDA or saline injection. Scale bar = 100 μm. (D) Summary graph for layer distribution of c-fos positive neurons in wild-type mice after NMDA or saline injection. No significant difference was detected in layer 1. The density of c-fos positive cells was increased in the other cortical layers. The density of c-fos cells in NMDA-injected mice was smaller in layer 5 than in layers 4 and 6. (E) Activated brain regions after NMDA injection are summarized in a cartoon. Sensorimotor regions are indicated in orange. Stress associated regions are indicated in blue. Arrows indicate known neural connections. Abbreviations (MO: somatomotor areas, SS: somatosensory areas, CP: caudoputamen, FS: fundus of striatum, PVT: paraventricular nucleus of thalamus, PVH: paraventricular hypothalamic nucleus, ARH: arcuate hypothalamic nucleus, GPe: globus pallidus, external segment, BST: bed nucleus of stria terminalis). Data are described in a scatter plot of each value with means ± SEM (numbers of animals examined are shown in graphs). Statistical analyses were performed by Student’s t-test (* p < 0.05; N.S. = not significant).

