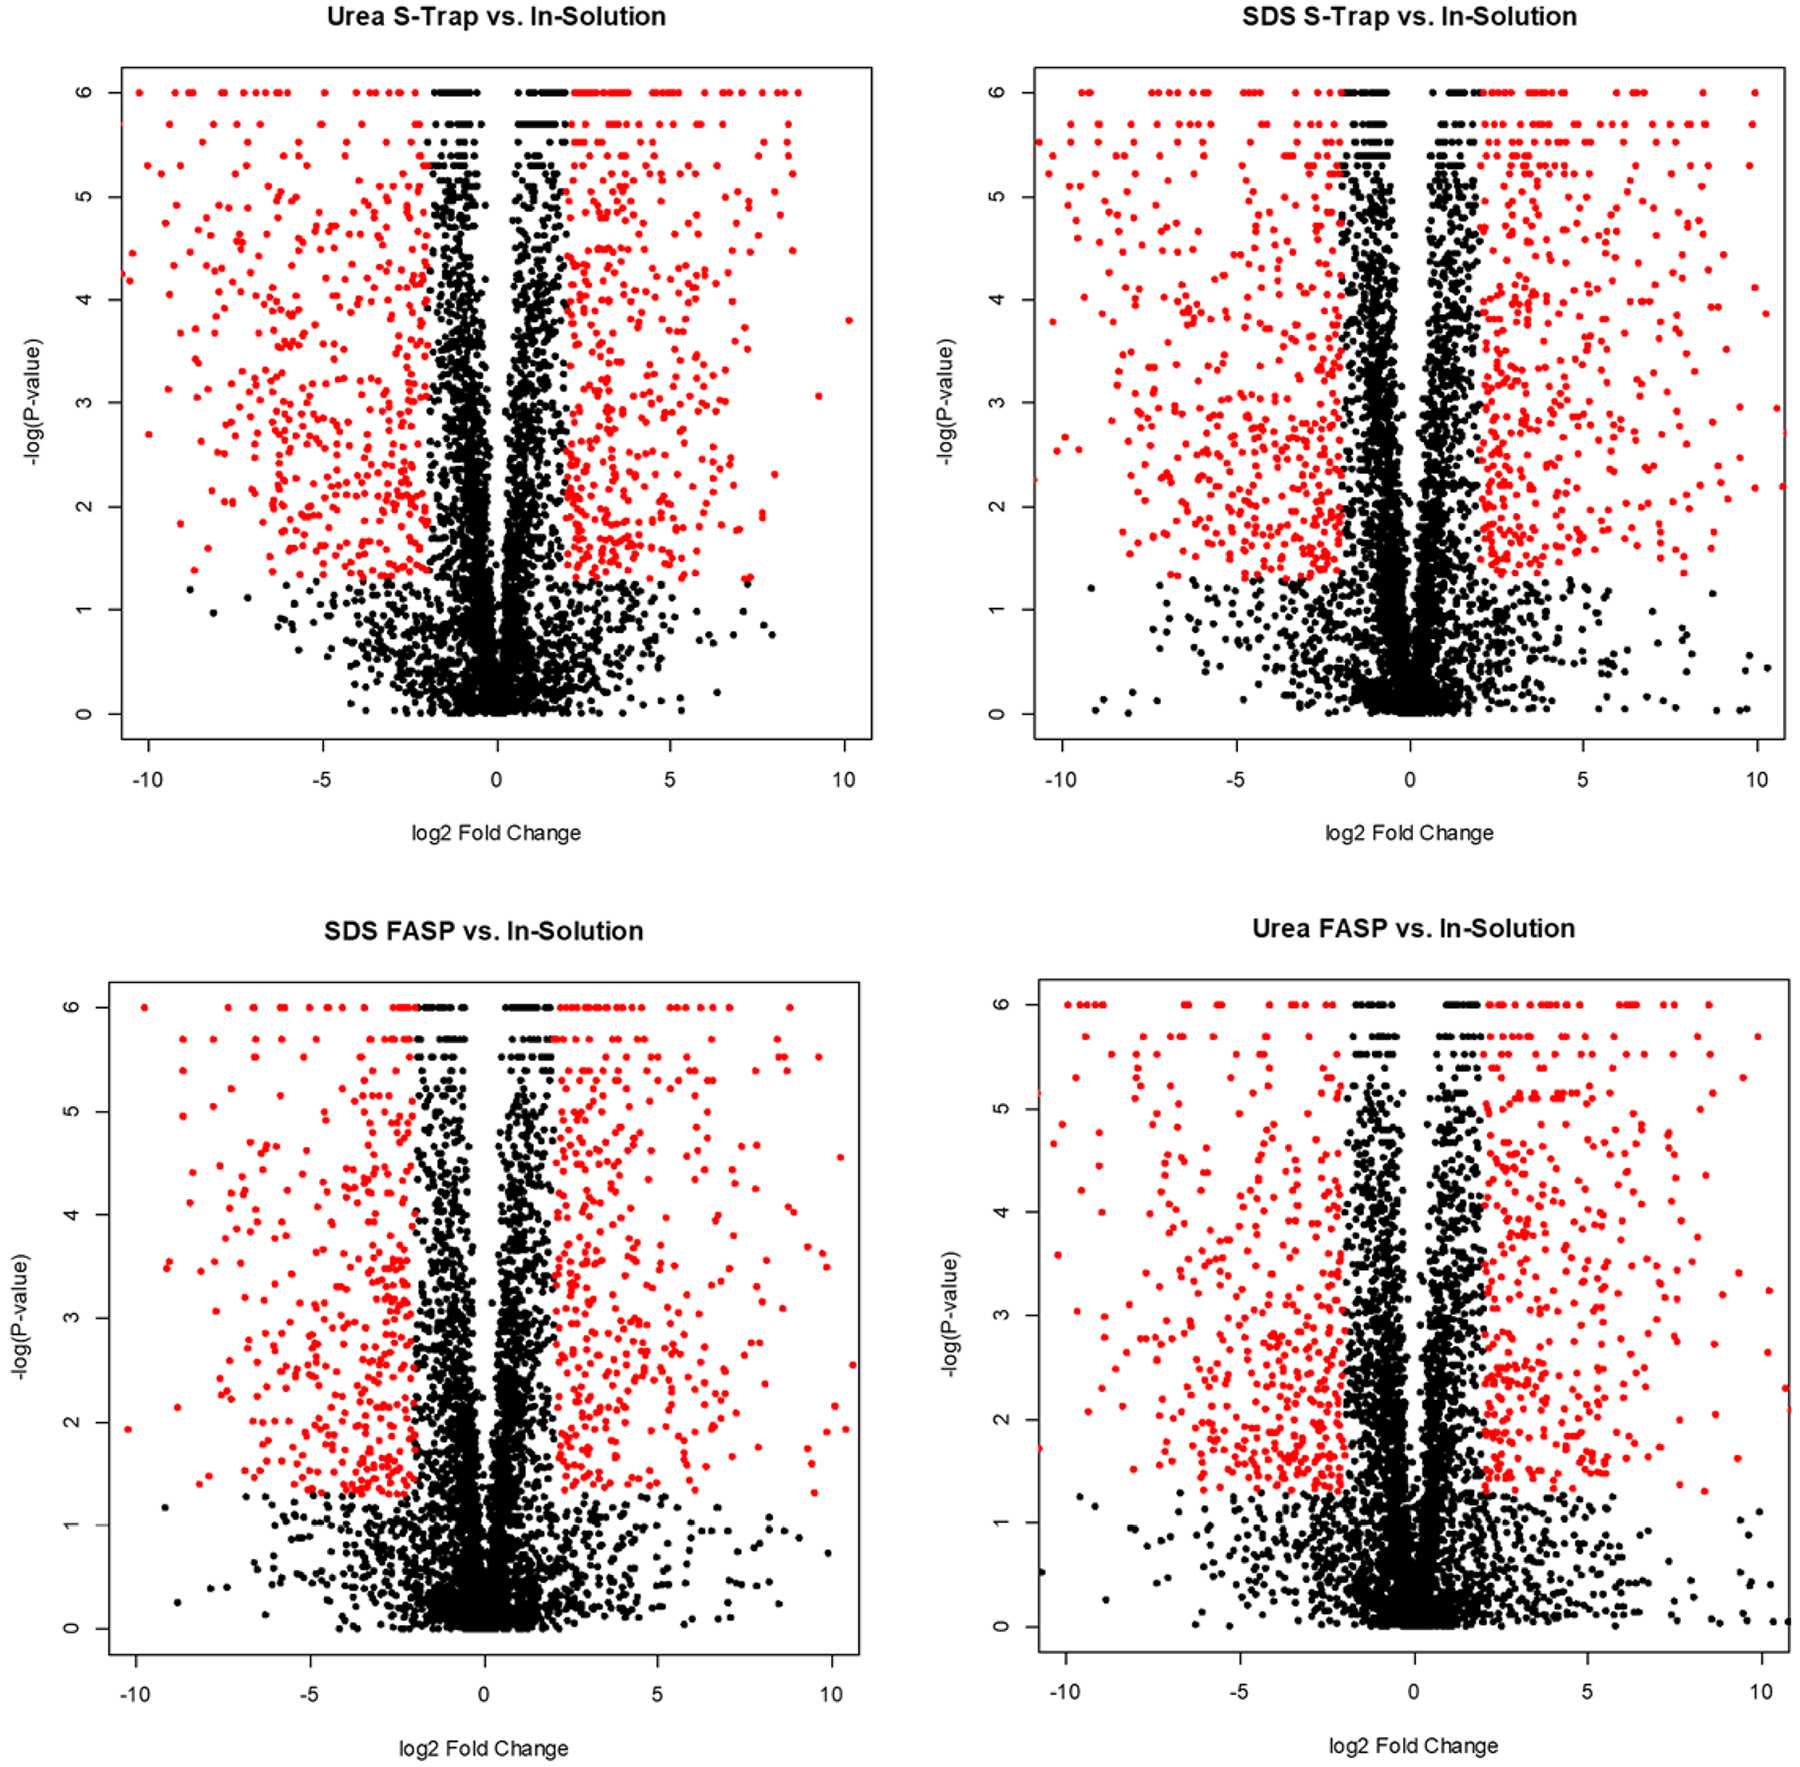
Figure 6.

Volcano plots displaying the statistical p-value with the magnitude of abundance changes between each digestion mode compared to in-solution digestion. Red dots indicate proteins that meet the threshold for differential regulation (log2 > 2 or log2 < −2 with a p-value <0.05).
