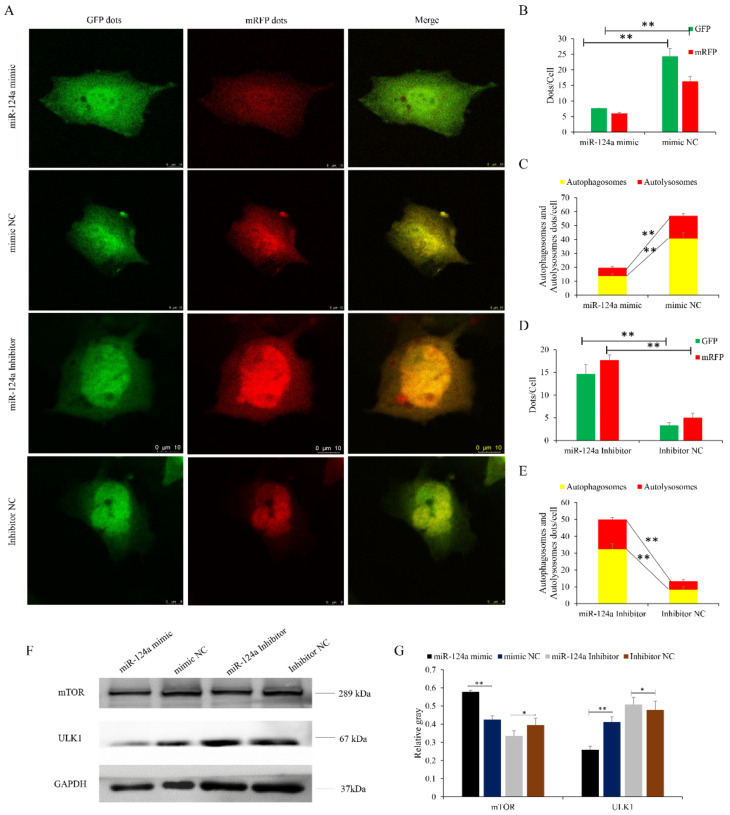
Figure 9.
VMP1 promotes myoblast autophagy: (A) An adenovirus harboring tandem fluorescent mRFP-GFP-LC3 was used to evaluate the extent of autophagic flux after VMP1 overexpression or silencing. (B,D) Mean numbers of green and red puncta per cell; three cells were randomly selected from each field to be counted. (C,E) Mean numbers of autophagosomes and autolysosomes per cell. Autophagosomes contain both green and red puncta; in the merged images, the puncta appear yellow. Autolysosomes contain red puncta only. (F,G) Levels of ULK1/mTOR were detected after VMP1 overexpression or silencing. GAPDH was used as an internal standard. Replicates = 3. Data are presented as the mean ± SE; * p < 0.05 and ** p < 0.01.

