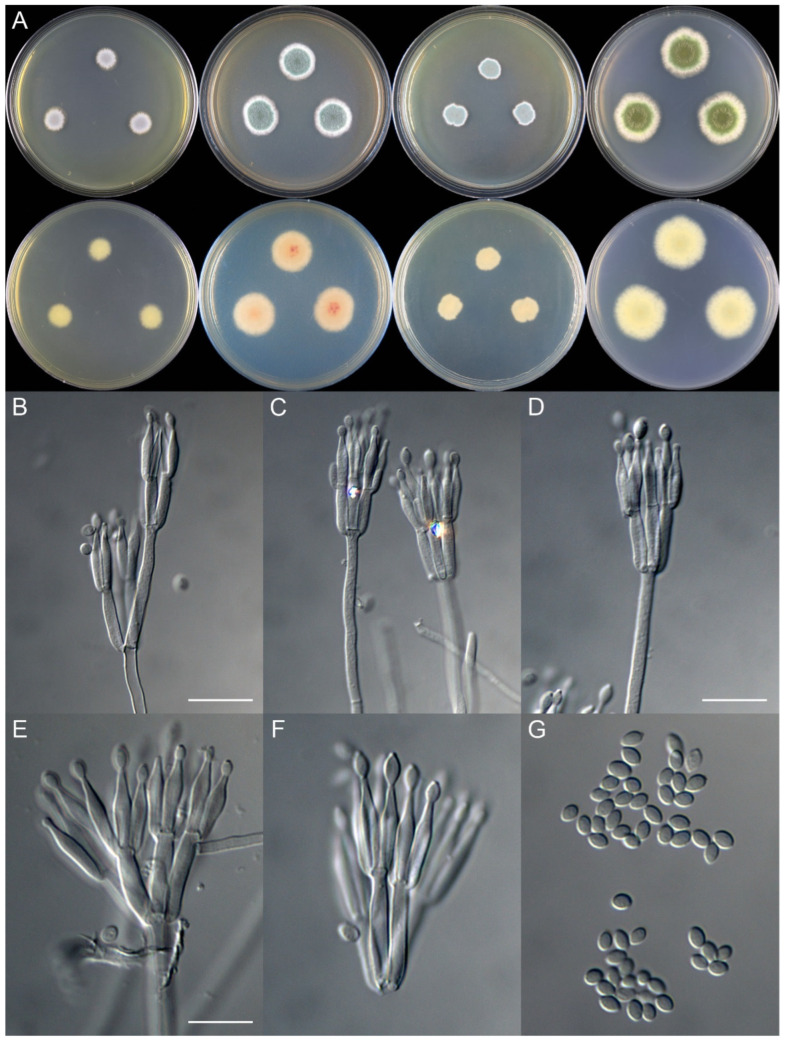
Figure 2.
Colonial and microscopic morphology of Talaromyces ginkgonis (10725). (A) Colony phenotypes (25 °C, 7 days; top row left to right, obverse CYA, MEA, YES, and PDA; bottom row left to right, reverse CYA, MEA, YES, and PDA); (B–F) Conidiophores; (G) Conidia. Bars: B = 15 µm, applies to C; D = 12.5 µm; E = 10 µm, applies to F and G.

