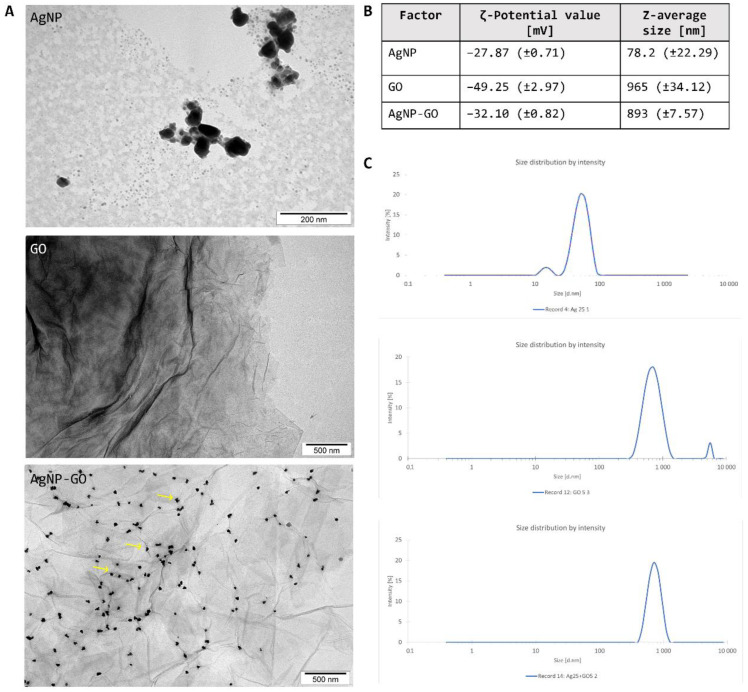
Figure 1.
The characterization of the experimental factors. (A) The transmission electron microscopy (TEM) visualization of the AgNP, GO, and AgNP-GO complex. Examples of AgNP adhesion places are marked by yellow arrows. (B) Zeta potentials and Z-average size by dynamic light scattering analysis of the evaluated nanomaterials. (C) Size distributions of the analyzed hydrocolloids in water.

