Figure 3.
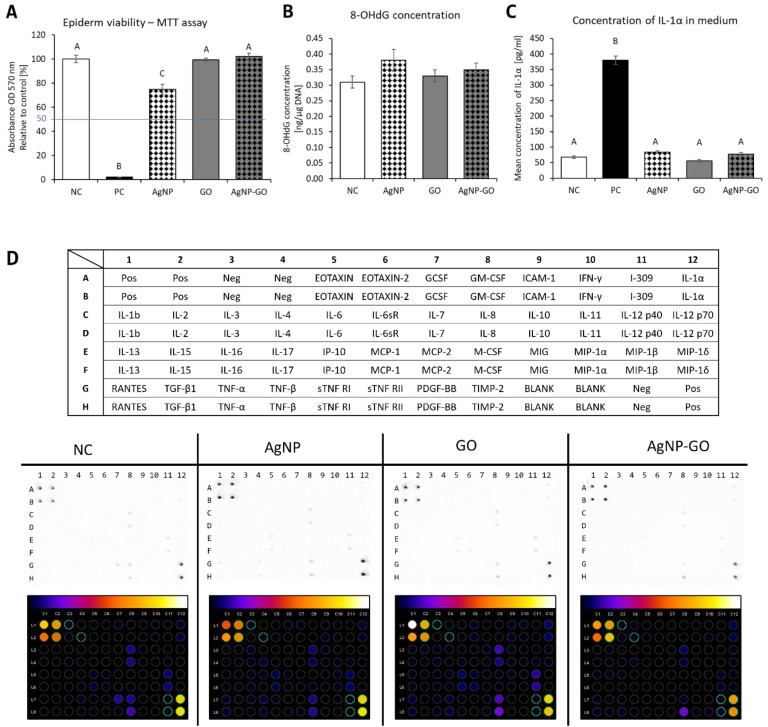
Biocompatibility of nanomaterials with Epiderm™. NC—negative control (DPBS), PC—positive control (5% SDS), AgNP—silver nanoparticles, GO—graphene oxide, AgNP-GO—complex. (A) EpiDerm™ viability measured by mitochondrial activity depletion. The MTT assay was performed 48 h after nanofactor treatments. The blue line represents the critical point at the level of 50%, below which the factor is recognized as an irritant. (B) The expression level of the oxidative DNA damage marker, 8-hydroxy-2’-deoxyguanosine (8-OHdG), in tissue as evaluated by enzyme-linked immunosorbent assays (ELISA). (C) The concentration level of the IL-1α released from Epiderm™ to the medium 24 h after experimental factor treatments, evaluated by a colorimetric ELISA test. The highest response was observed in the positive control (PC) group, which proves the functionality of the system. (D) Effect on the protein expression of proinflammatory cytokines in EpiDerm™ 24 h after treatment. The table represents a scheme of the protein pattern at the membrane. The results are normalized to the negative control (NC) group. Images were created with ImageJ software. The error bars represent standard error of mean (n = 4 per group). Different letters (A–C) above the columns indicate statistically significant differences (p ≤ 0.01) analyzed by Tukey’s HSD test.

