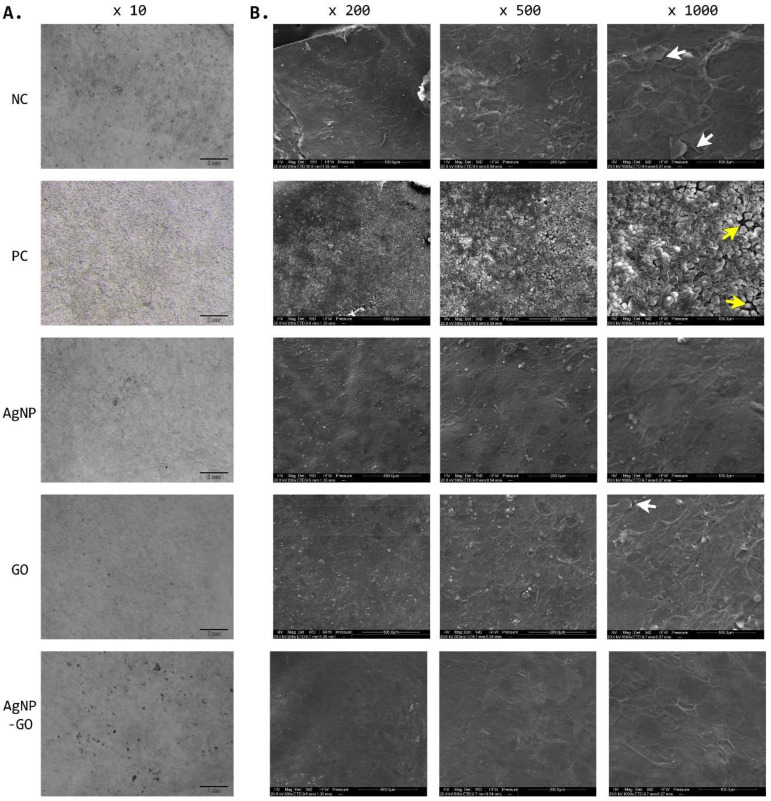
Figure 4.
Visualization of EpiDerm™ surface 24 h after treatment. Comparison of silver nanoparticles (AgNP), graphene oxide (GO), and AgNP-GO complex activity to the negative control (NC, DPBS) and positive control (PC, SDS). (A) Digital photos of EpiDerm™ without fixation were obtained using a stereo microscope. (B) Tissues imaged in a scanning electron microscope were fixed in 2.5% l-glutaraldehyde in PBS. White arrows indicate the places of exfoliation and keratinization of the top layer; yellow arrows indicate a disruption of the continuity of the tissue surface.

