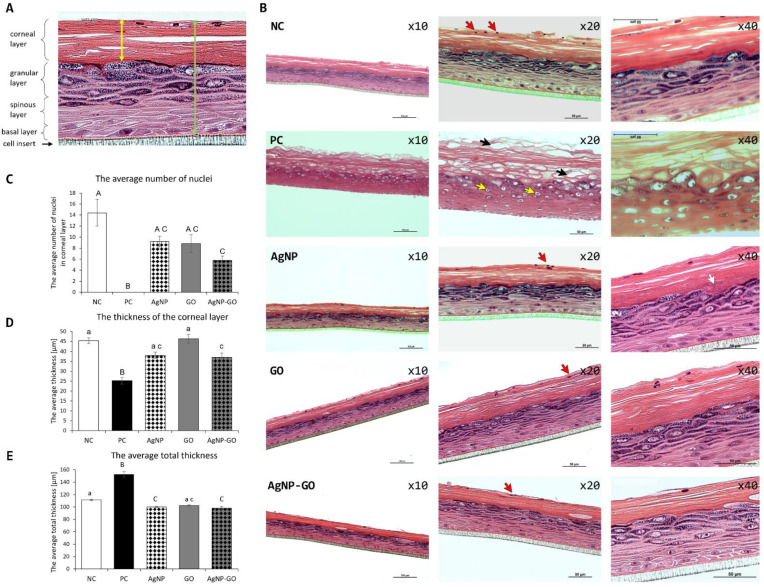
Figure 5.
The EpiDerm™ morphology evaluated by optical microscopy after hematoxylin-eosin cross section staining. (A) Scheme of the EpiDerm™ structure. The double headed arrows indicate the boundaries of the measurement for the thickness of the corneal layer (yellow) and total thickness (green). (B) Visualization of the tissues after treatment at 10×, 20×, and 40× magnifications. Red arrows indicate the nuclei, black arrows indicate tissue damaged after SDS treatment, yellow arrows show the necrosis process, and the white arrow shows a place with local thickening of the stratum corneum. (C) The average number of nuclei in stratum corneum. (D) The average thickness of stratum corneum. (E) The average total thickness. Different letters (a, c) and (A–C) above the columns indicate statistically significant differences (p ≤ 0.05 and p ≤ 0.01 respectively) as analyzed by Tukey’s HSD test. NC—negative control, PC—positive control, AgNP—silver nanoparticles, GO—graphene oxide, AgNP-GO—complex of silver nanoparticles and graphene oxide.

