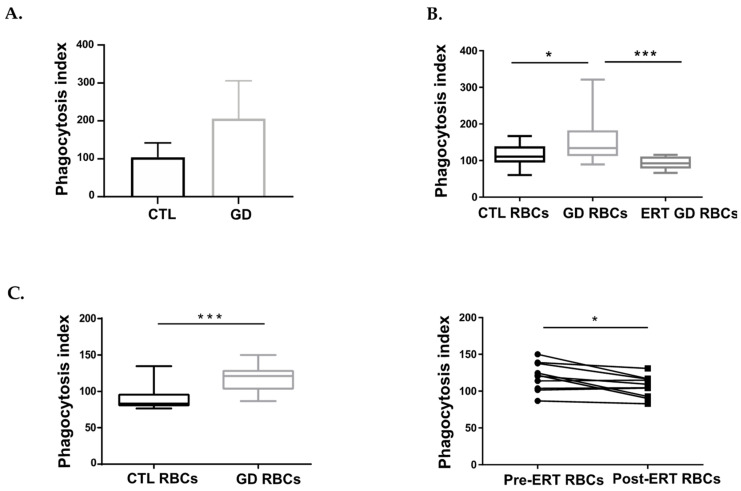
Figure 1.
GD RBCs exhibit higher phagocytosis index (PI) by macrophages than CTL RBCs. (A) Erythrophagocytosis assays were performed using primary macrophages derived from healthy donor’s monocytes (CTL) or monocytes-derived macrophages from untreated GD patients (GD) and polarized toward the M2 phenotype. CTL macrophages were co-incubated with the autologous CTL RBCs (n = 3) and GD macrophages were co-incubated with the autologous GD RBCs (n = 3). The chart represents the PI of CTL and GD samples. The means and standard deviation are represented. (B) Erythrophagocytosis assays were performed using primary macrophages derived from healthy donor monocytes and polarized toward the M2 phenotype. The chart represents the PI of CTL samples (CTL RBCs; n = 15) and untreated GD samples (GD RBCs; n = 15), and treated GD samples (ERT GD RBCs, n = 8). Group comparison was performed using a Mann-Whitney test. The medians are represented as horizontal bars; the upper and lower quartiles are represented as the top and the bottom of the box, respectively; and the maximum and minimum data values are shown by dashes at the top and the bottom, respectively, of the whiskers. * p < 0.05; *** p < 0.001. (C) Left panel: Erythrophagocytosis assays were performed using THP1-derived macrophages co-incubated with CTL RBCs (n = 11) or GD RBCs (n = 18). The chart represents the PI of CTL and GD RBCs obtained for this cohort. Group comparison was performed using a Mann-Whitney test. The medians are represented as horizontal bars; the upper and lower quartiles are represented as the top and the bottom of the box, respectively; and the maximum and minimum data values are shown by dashes at the top and the bottom, respectively, of the whiskers. *** p < 0.001. Right panel: Erythrophagocytosis assays were performed using THP1-derived macrophages. The effect of ERT treatment on the PI was evaluated for RBCs from 10 patients before (Pre-ERT RBCs) and after (Post-ERT RBCs) ERT treatment (longitudinal study). Group comparison was performed using a paired t-test. * p < 0.05.

