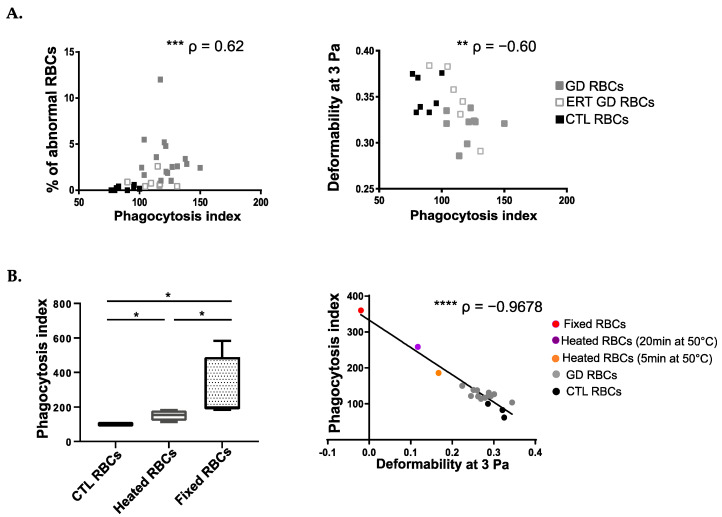
Figure 2.
The uptake of GD RBCs correlates with cell deformability and morphology. (A) Left panel: Positive correlation between the PI and the percentage of abnormal morphologies of RBCs. Right panel: Negative correlation between the PI and the deformability of RBCs at 3 Pa. GD, ERT GD, and CTL RBCs values are depicted with gray, white and dark squares, respectively. The p and ρ values were determined using the Spearman rank correlation test. ** p < 0.01; *** p < 0.001. (B) Left panel: Erythrophagocytosis assays were performed using THP1-derived macrophages co-incubated with untreated CTL RBCs (n = 4) or CTL RBCs (n = 4) artificially made less deformable after heating for 20 min at 50 °C or after fixation with glutaraldehyde at 0.025% (n = 4). The chart represents the PI. The medians are represented as horizontal bars; the upper and lower quartiles are represented as the top and the bottom of the box, respectively; and the maximum and minimum data values are shown by dashes at the top and the bottom, respectively, of the whiskers. Group comparison 2 by 2 was performed using a Mann-Whitney test. * p < 0.05. Right panel: Negative correlation between the PI and the deformability of RBCs at 3 Pa (n = 19). CTL RBCs, GD RBCs, and CTL RBCs artificially made less deformable after heating for 5 min or for 20 min at 50 °C or after fixation with glutaraldehyde were used. The p and ρ values were determined using the Pearson correlation test. **** p < 0.0001.

