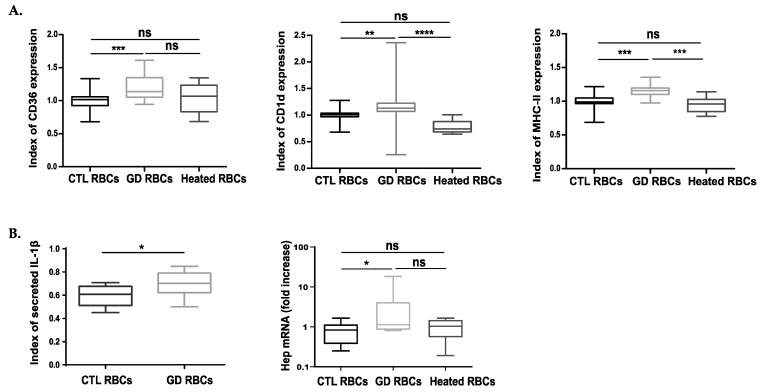
Figure 4.
The phagocytosis of GD RBCs induces phenotypic modifications of macrophages toward Gaucher cells phenotype. (A) The expression of different markers was investigated at the surface of THP1-derived macrophages after 12 h of phagocytosis of CTL (n = 20), GD (n = 18), or CTL Heated (n = 8) RBCs. The expression levels of the phagocytic marker CD36, as well as the immunological markers MHC-II and CD1d antigen, were evaluated by flow cytometry. The charts represent the index of marker expression. Group comparison was performed using a Kruskal-Wallis test for CD1d and CD36 and an ordinary one-way ANOVA for MHC-II. ** p < 0.01; *** p < 0.001; **** p < 0.0001. ns = non-significant. (B) Left panel: Secretion levels of IL-1β were measured by ELISA. The charts represent the index of secreted cytokine in the supernatant of macrophages having engulfed CTL (n = 12) or GD (n = 13) RBCs. Group comparison was performed using an unpaired t-test. * p < 0.05. Right panel: hepcidin mRNA (Hep) quantification by qRT-PCR in macrophages 3 h after phagocytosis of CTL (n = 7) or GD (n = 7) RBCs. The charts represent the fold increase quantification of hepcidin mRNA compared to the quantification assessed in macrophages before erythrophagocytosis. Group comparison was performed using a Kruskal-Wallis test. * p < 0.05. ns = non-significant. The medians are represented as horizontal bars; the upper and lower quartiles are represented as the top and the bottom of the box, respectively; and the maximum and minimum data values are shown by dashes at the top and the bottom, respectively, of the whiskers.

