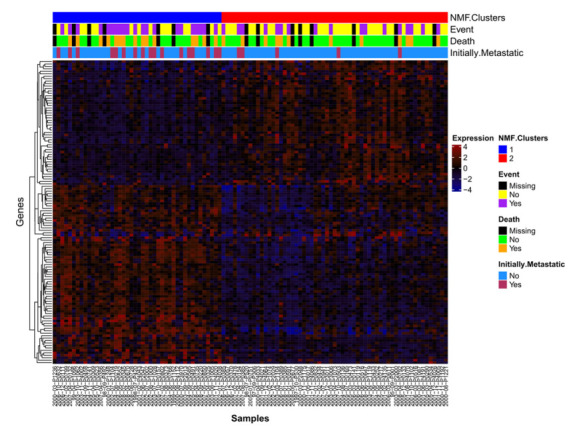
Figure 1.

Differentially expressed genes. Samples with HuEx data (n = 103) are listed along the x-axis and expression probesets are hierarchically clustered (complete linkage, average distance) on the y-axis. mRNA expression clusters 1 (blue) and 2 (red) are annotated.
