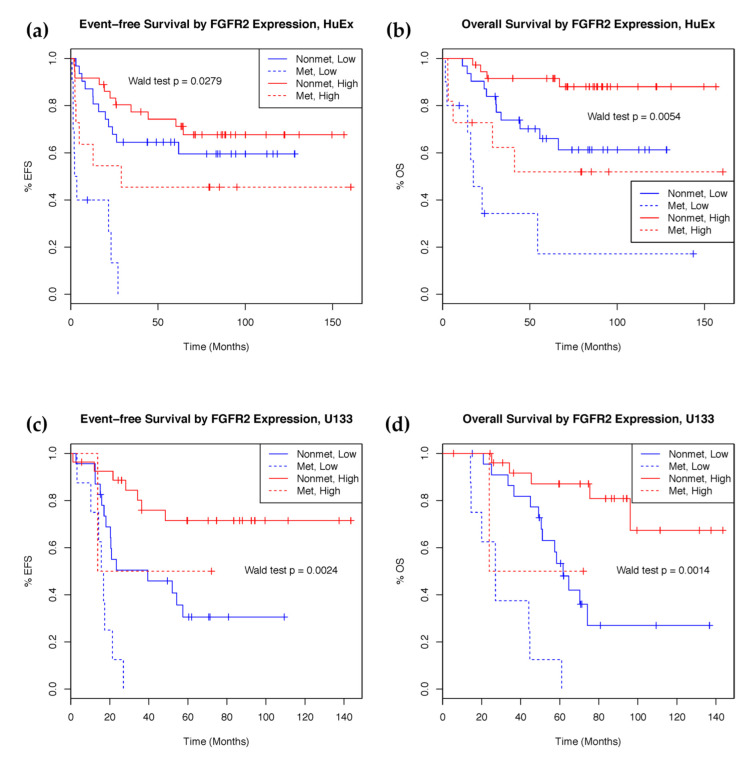
Figure 2.
Kaplan–Meier curves showing survival rate difference between patients with high and low expression of FGFR2. (a) Event-free survival and (b) overall survival in the HuEx discovery cohort (n = 88). (c) Event-free survival and (d) overall survival in the U133 validation cohort (n = 60). FGFR2 expression stratified into high (red) and low (blue) expression groups at the 50th percentile.

