Figure 1.
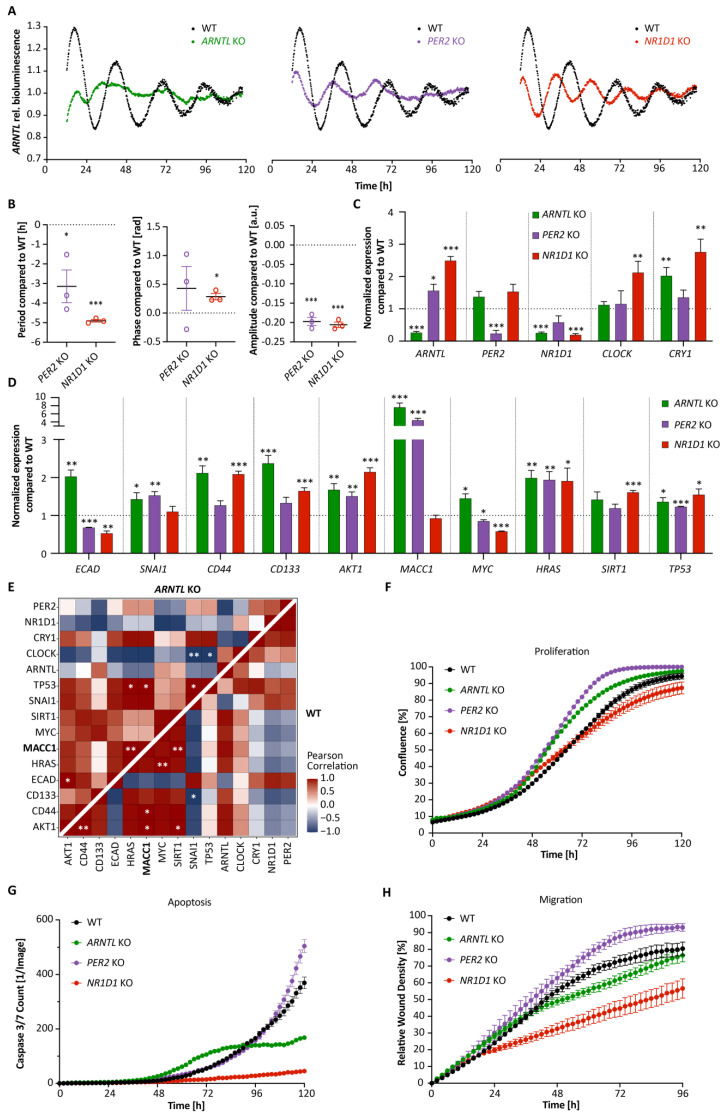
ARNTL promoter activity shows different oscillation patterns in HCT116 knockout cell lines. (A) Bioluminescence readouts for the promoter activity of ARNTL over the course of 120 h in HCT116 WT and CC knockout (ARNTL KO, PER2 KO and NR1D1 KO) cell lines. (B) Period, phase and amplitude analysis of bioluminescence data of HCT116 knockout cells using Chronostar (n = 3, mean ± SEM). TWT = 26.1 ± 0.1 h, TARNTL KO = ND, TPER2 KO = 23.0 ± 0.8 h, TNR1D1 KO = 21.2 ± 0.1 h. (C) Gene expression analysis of CC genes PER2, CRY1, NR1D1, CLOCK, and ARNTL in HCT116 WT and knockout cell lines at 24 h after synchronization (n = 3, mean ± SEM). (D) Gene expression analysis of related genes in EMT, cell cycle, death and metastasis in HCT116 CC knockout cell lines at 24 h after synchronization (n = 3, mean ± SEM). (E) Heatmaps of Pearson correlation between each pair of CC and EMT-related genes for HCT116 WT versus ARNTL KO. (F–H): Proliferation (F), Apoptosis (G) and Migration (H) analysis of HCT116 WT and CC knockouts using live-cell imaging over several days (n > 8, mean ± SEM, significance tested by comparing AUC to WT, two-tailed unpaired t-test). ND: not defined. * p < 0.05, ** p < 0.01, *** p < 0.001, two-tailed unpaired t-test.

