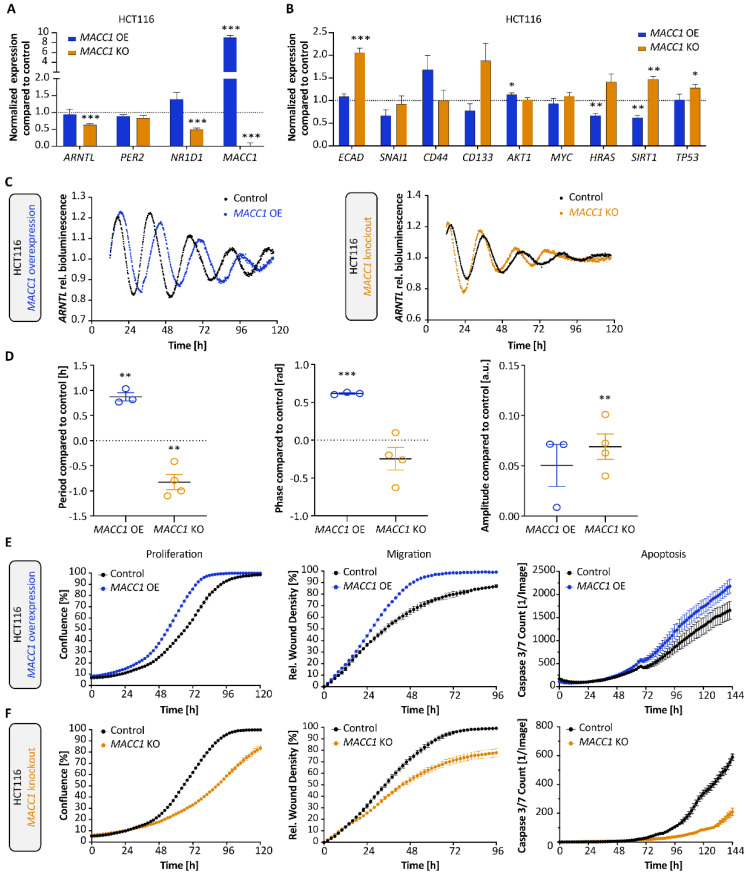
Figure 3.
MACC1 manipulation affects clock phenotype in HCT116 cells. Gene expression analysis of CC genes ARNTL, PER2 and NR1D1 (A) as well as EMT-related genes (B) in HCT116 MACC1 overexpressing (OE) and MACC1 knockout (KO) cells, respectively. Samples were collected at 24 h after synchronization (n = 3, mean ± SEM). (C,D) ARNTL promoter activity in HCT116 MACC1 OE and HCT116 MACC1 KO cell lines. Measurements were taken over five days using live-cell bioluminescence recordings. Period, phase and amplitude were measured using Chronostar (n ≥ 3, mean ± SEM). TControl = 24.9 ± 0.1 h and TMACC1 OE = 25.8 ± 0.1 h, TControl = 23.5 ± 0.1 h and TMACC1 KO = 22.4 ± 0.2 h. * p < 0.05, ** p < 0.01, *** p < 0.001; two-tailed unpaired t-test. (E,F) Proliferation, migration and apoptosis analysis of HCT116 MACC1 OE (E) and HCT116 MACC1 KO (F) cell lines using live-cell imaging (n > 8, mean ± SEM, significance tested by comparing AUC with the respective control cell line, two-tailed unpaired t-test).

