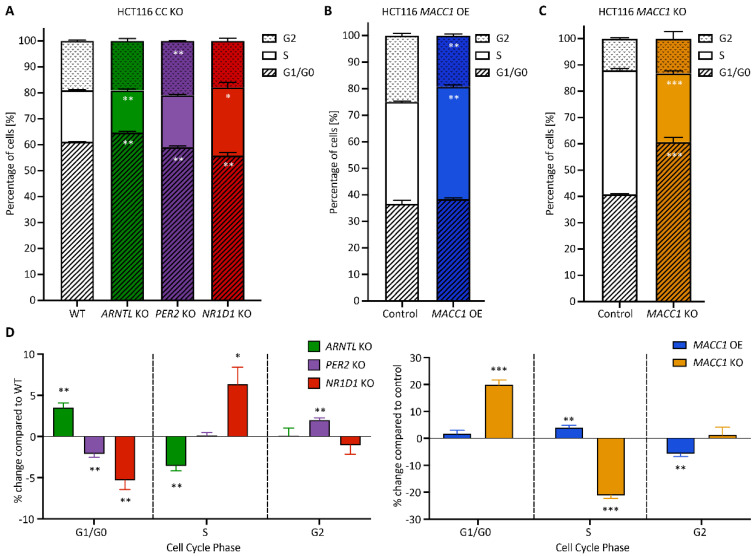
Figure 5.
CC KO and MACC1 manipulation alter cell cycle dynamics in HCT116. Cell cycle phase distribution in CC KO HCT116 cells (A) as well as (B) MACC1 overexpressing and (C) MACC1 KO HCT116 cells. (D) Normalized cell cycle phase distribution in CC KO and MACC1 manipulated HCT116 cells compared with WT or control, respectively (n = 3, mean ± SEM, * p < 0.05, ** p < 0.01, *** p < 0.001; two-tailed unpaired t-test). Cells were synchronized and collected 24 h after synchronization.

