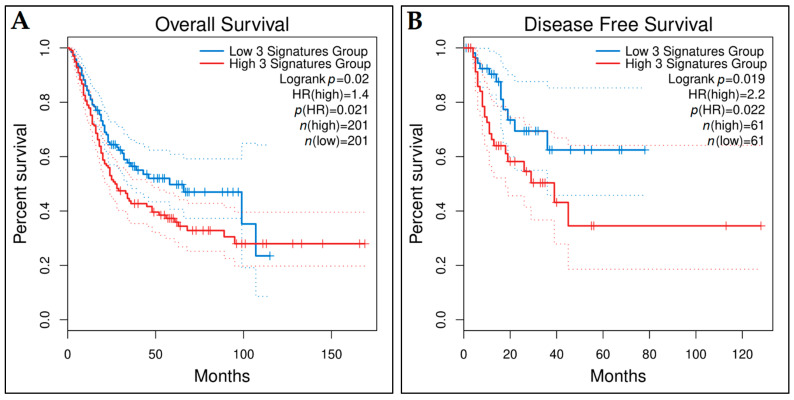
Figure 17.
Kaplan–Meier survival plots of the three-gene prognostic signature, generated using the GEPIA2 platform. Red and blue lines indicate the high- and low-risk patient groups, respectively. Patients were grouped according to (A) median cut-off value for overall survival and (B) a custom cut-off high and low value of 85% and 15%, respectively, for disease-free survival.

