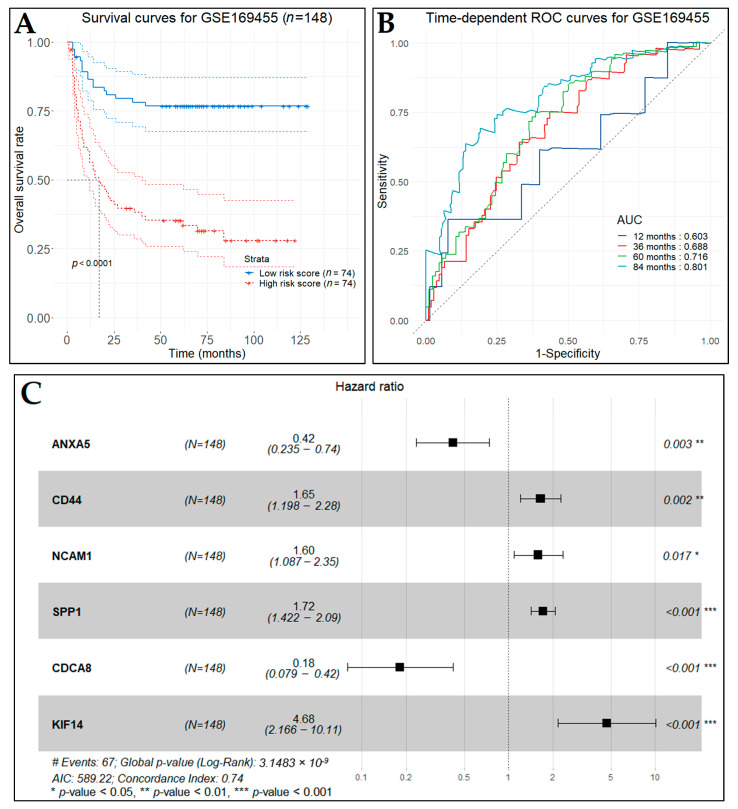
Figure 21.
Survival analysis for the GSE169455 (n = 148) dataset (training set). (A) Kaplan–Meier curves for disease-free survival of MIBC patients who received cisplatin-based chemotherapy as stratified by the six-gene predictive index. Patients were divided into low- and high-risk groups according to the median predictive index. (B) Time-dependent ROC curves (one-, three-, five-, and 10-year predictions) to assess the predictive accuracy of the six-gene predictive model. (C) Forest plot for multivariate Cox regression analysis on the GSE169455. The figure incorporates the hazard ratio value (ecoef) along with the 95% CI and p-value for each gene.

