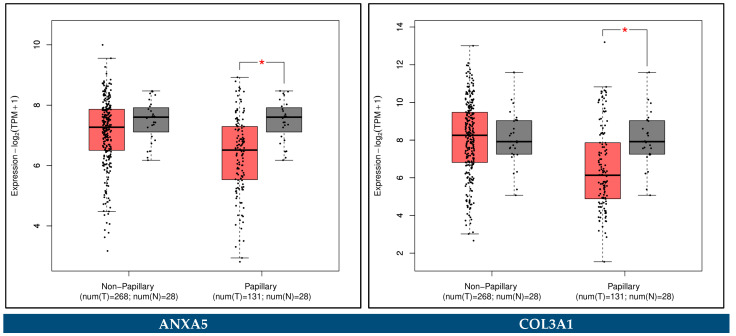
Figure 26.
The gene expression level analysis of the ANXA5 and COL3A1 in BCa patients for non-papillary and papillary subtypes, generated using the GEPIA2 platform. The red boxes represent the mRNA expression levels in BCa subtype tissues and the gray boxes represent the expression levels in control bladder tissues from patients of the TCGA-BCa and GTEx cohorts. * indicates statistical significance applying p-value < 0.05 and |log2FC| < 1 as cut-off criteria (TPM: transcript count per million).

