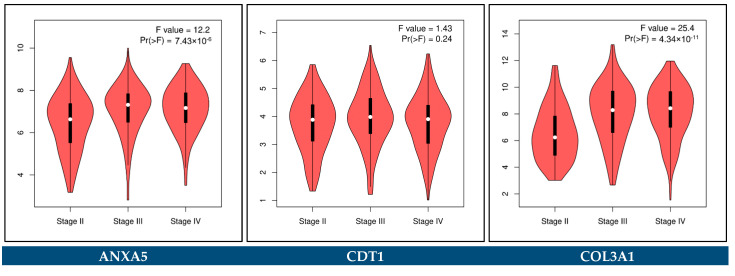
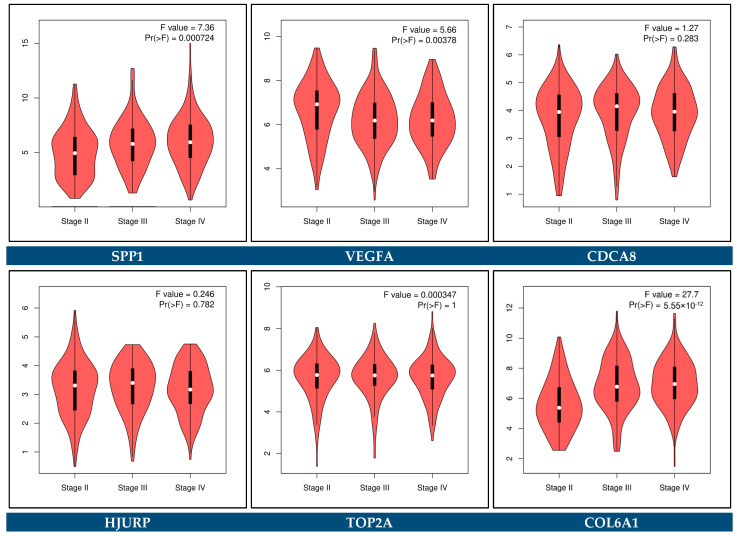
Figure 27.
Violin plots representing the association between the expression levels of the nine key biomarker genes and the three pathological tumor stages among BCa patients, generated using the GEPIA2 platform and based on the TCGA-BLCA cohort. F value and Pr(>F) indicate the statistical value and the p-value of the F-test, respectively.


