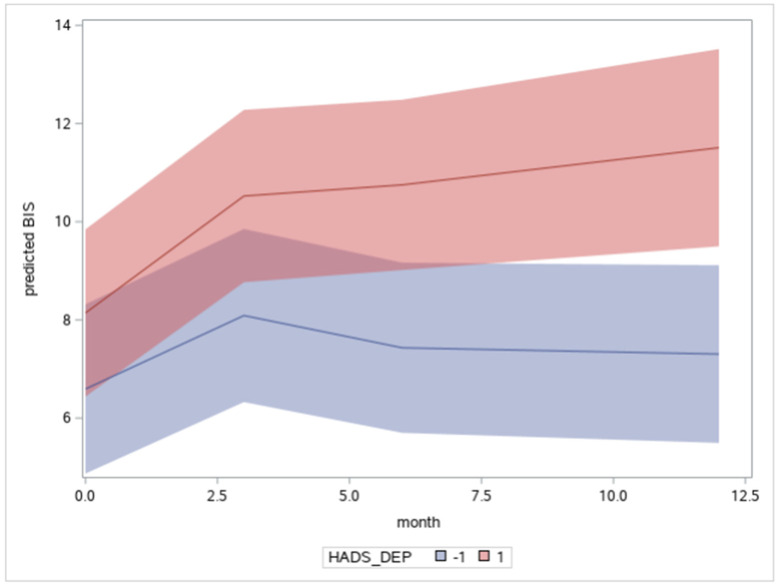
Figure 4.
Plot of the Time × Depression interaction as a function of months. Note. The blue line estimates the growth curve of individuals with depression scores −1 SD below the mean and the red line +1 SD above the mean, controlling for other factors. Shaded regions indicate the 95% confidence limits.

