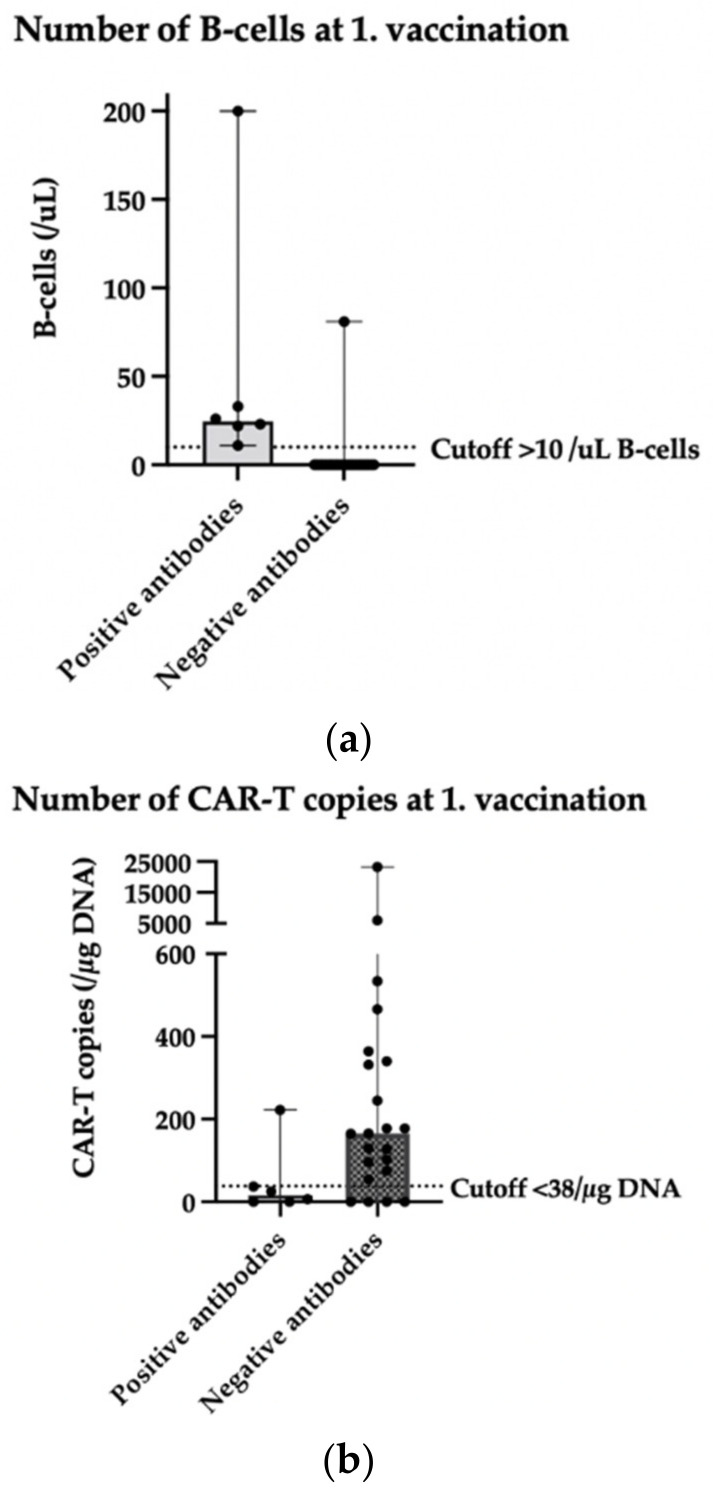
Figure 3.
Scatter plot (median with range) depicting (a) number of B-cells at time of 1st vaccination and (b) number of CAR-T-cell copies at time of 1st vaccination in patients with positive anti-spike protein IgG antibody test result (>12AU/mL) compared to patients with a negative antibody test result. (a) n = 28 patients (21 patients with negative antibodies overlap at 0/uL B-cells); (b) n = 28 patients.

