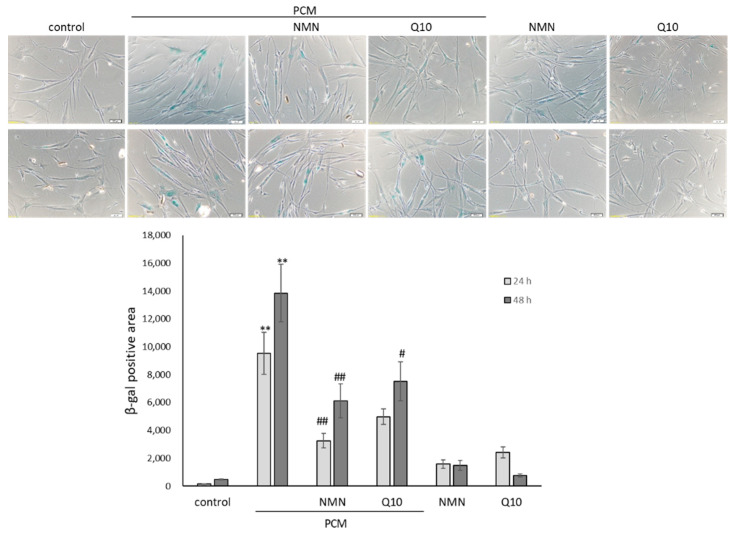
Figure 4.
The effect of PCM on senescence in HDFs for 24 h and 48 h. The upper panel represents the cytochemical staining of SA-β-Gal (blue). The levels of positively stained area within various treatments were quantitatively compared in triplicate with mean values ± SEM. ** p < 0.01 compared with mock control and # p < 0.05, ## p < 0.01 compared with PM-conditioned medium group.

