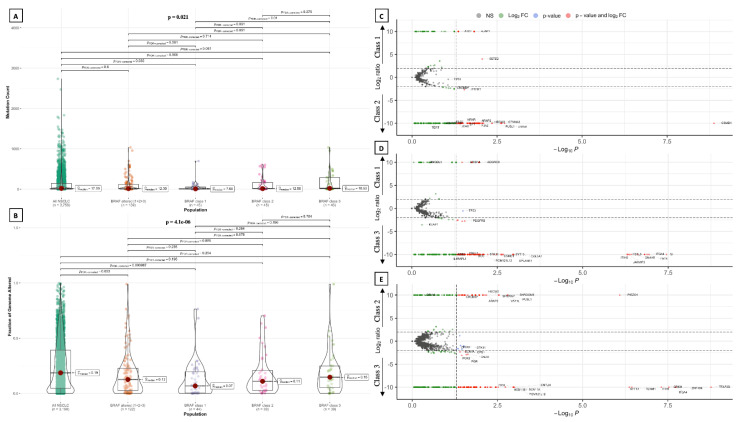
Figure 5.
Violin plots show a comparison in terms of mutation count (A) and fraction of genome altered (B) among the three BRAF functional classes, showing a significantly higher mutation count in patients harboring class 3 alterations compared to those with class 1 alterations. Volcano plots comparing gene co-alteration frequency in patients harboring BRAF alterations of class 1 vs. class 2 (C), class 1 vs. class 3 (D), and class 2 vs. class 3 (E). NS: not significant.

