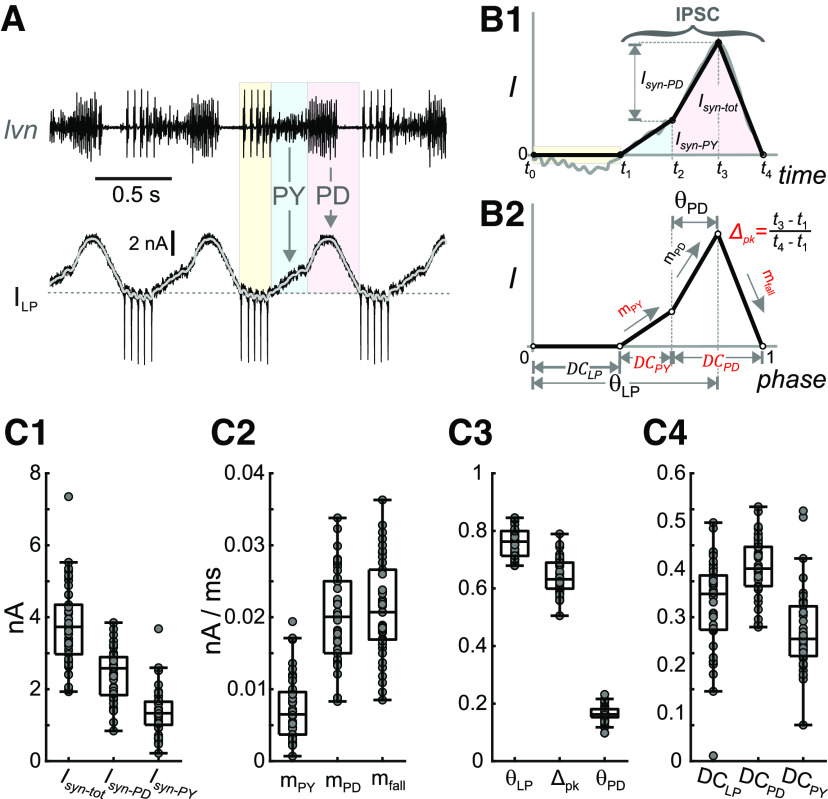
Figure 3.
Parameters that define the synaptic input show considerable variability. A, Total current measured in the LP neuron voltage clamped at a holding potential of −50 mV during the ongoing pyloric rhythm. The pyloric rhythm is recorded extracellularly (lvn), indicating the timing of the LP, PY, and PD neuron bursts. LP action potentials escape the voltage clamp and can be seen in the current and extracellular recordings (pale yellow). The portion of the current outside this range is because of synaptic input (downward arrows) from the PY (light blue) and pacemaker (PD, pink) neurons. The gray curve is the current low-pass filtered (<20 Hz). B1, The synaptic waveform shape (gray curve) during a single cycle of oscillation is approximated by a piecewise-linear curve (black curve), marked by five time points (t0–t4) denoting the borders of the colored regions in panel A. The time range of the IPSC and the amplitudes of the synaptic currents because of the pacemaker neurons (Isyn-PD), because of the PY neurons (Isyn-PY), and the sum of the two (Isyn-tot) are marked. B2, The piecewise-linear curve of B1 shown in phase (time/period). This normalized curve is used to define the parameters of synaptic input to the LP neuron. For definitions, please refer to the main text. Five primary parameters (in red) are chosen for further analysis. C, The interindividual variability of different synaptic parameters, including current amplitudes (C1), slopes (C2), peak phases (C3), and duty cycles (C4).

