
Figure 7.
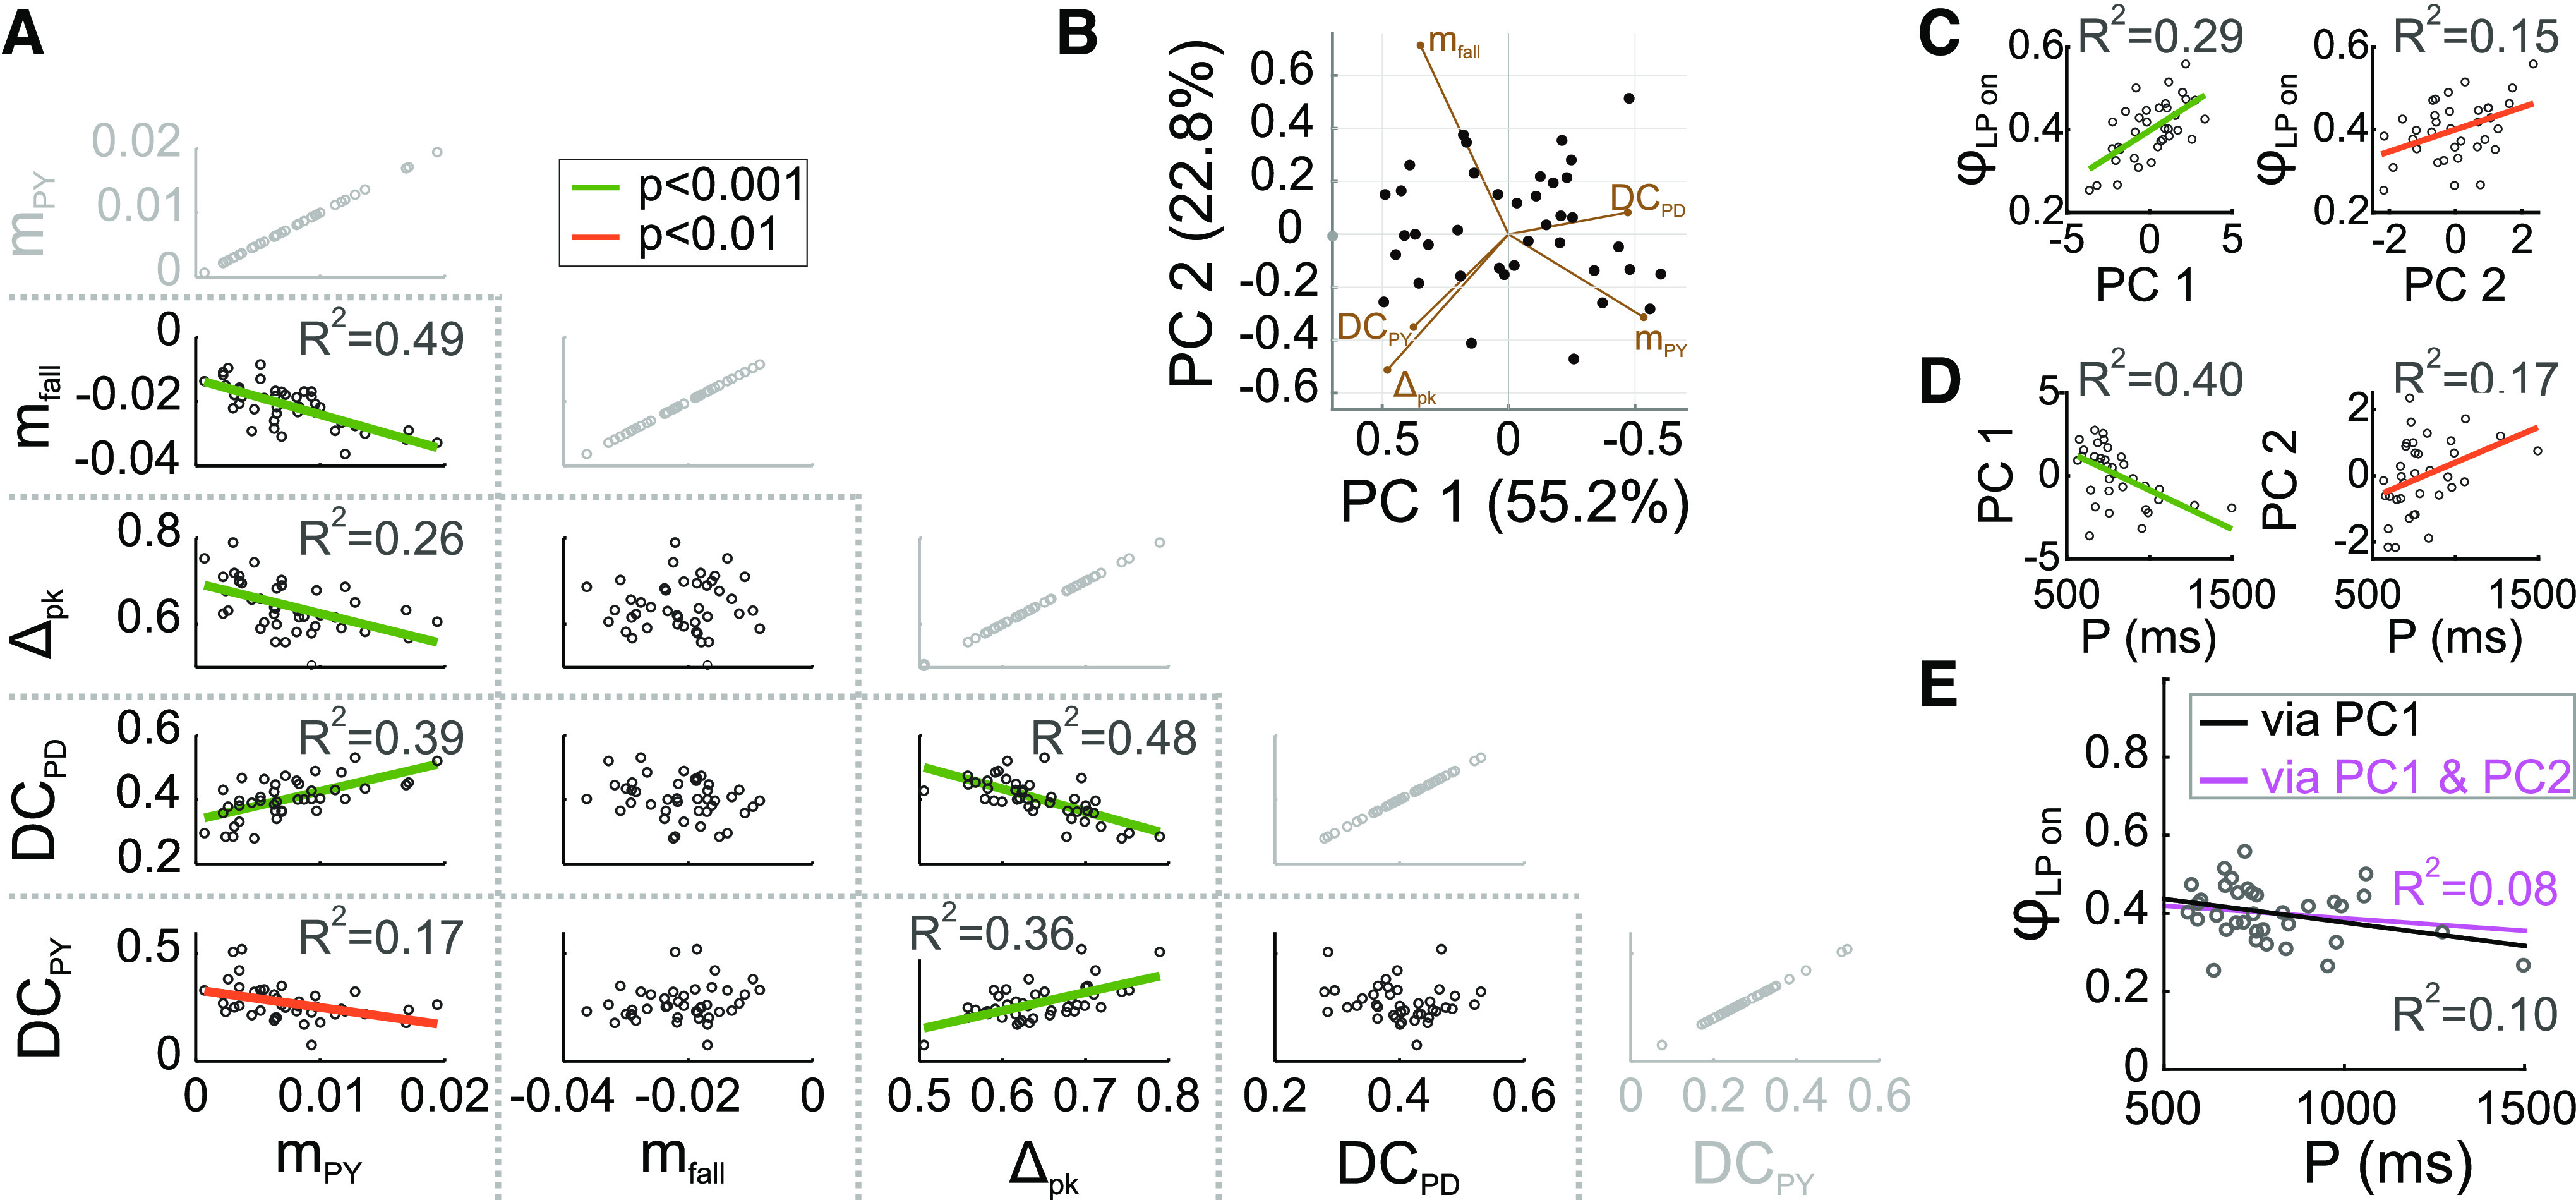
The primary synaptic parameters are correlated. A, The five primary synaptic parameters were compared pairwise across preparations. Of the 10 nontrivial comparisons (shown in black), 6 showed significant correlations. The trivial comparisons (gray) are shown for clarity. B, PCA was used to find directions of largest variability among the five synaptic parameters. The first two principal components described 78% of the variability in synaptic parameters. Filled circles show all recorded synaptic waveforms, projected down to the PC1-PC2 plane. Percentages on axis labels indicate the extent of variability in the direction of the PC. The directions of the five primary synaptic parameters in the PC1-PC2 plane are indicated by brown line segments (biplot). See Extended Data Figure 7-1 for projections onto all PC subplanes. C, Across preparations, the LP burst onset phase (ϕLP) is correlated with both PC1 and PC2 (but not PC3, PC4, or PC5). D, Across preparations, both PC1 and PC2 (but not PC3, PC4, or PC5) are correlated with the pyloric cycle period (P). E, Using the PC1 and PC2 correlations with ϕLP and P (lines in left graphs of panels C, D) to calculate a linear relationship (black line) between ϕLP and P correctly predicts a lack of correlation between these two factors. Including both the PC1 and PC2 correlations (all lines in panels C, D) to do the linear prediction (magenta line) does not greatly improve the prediction.