Figure 9.

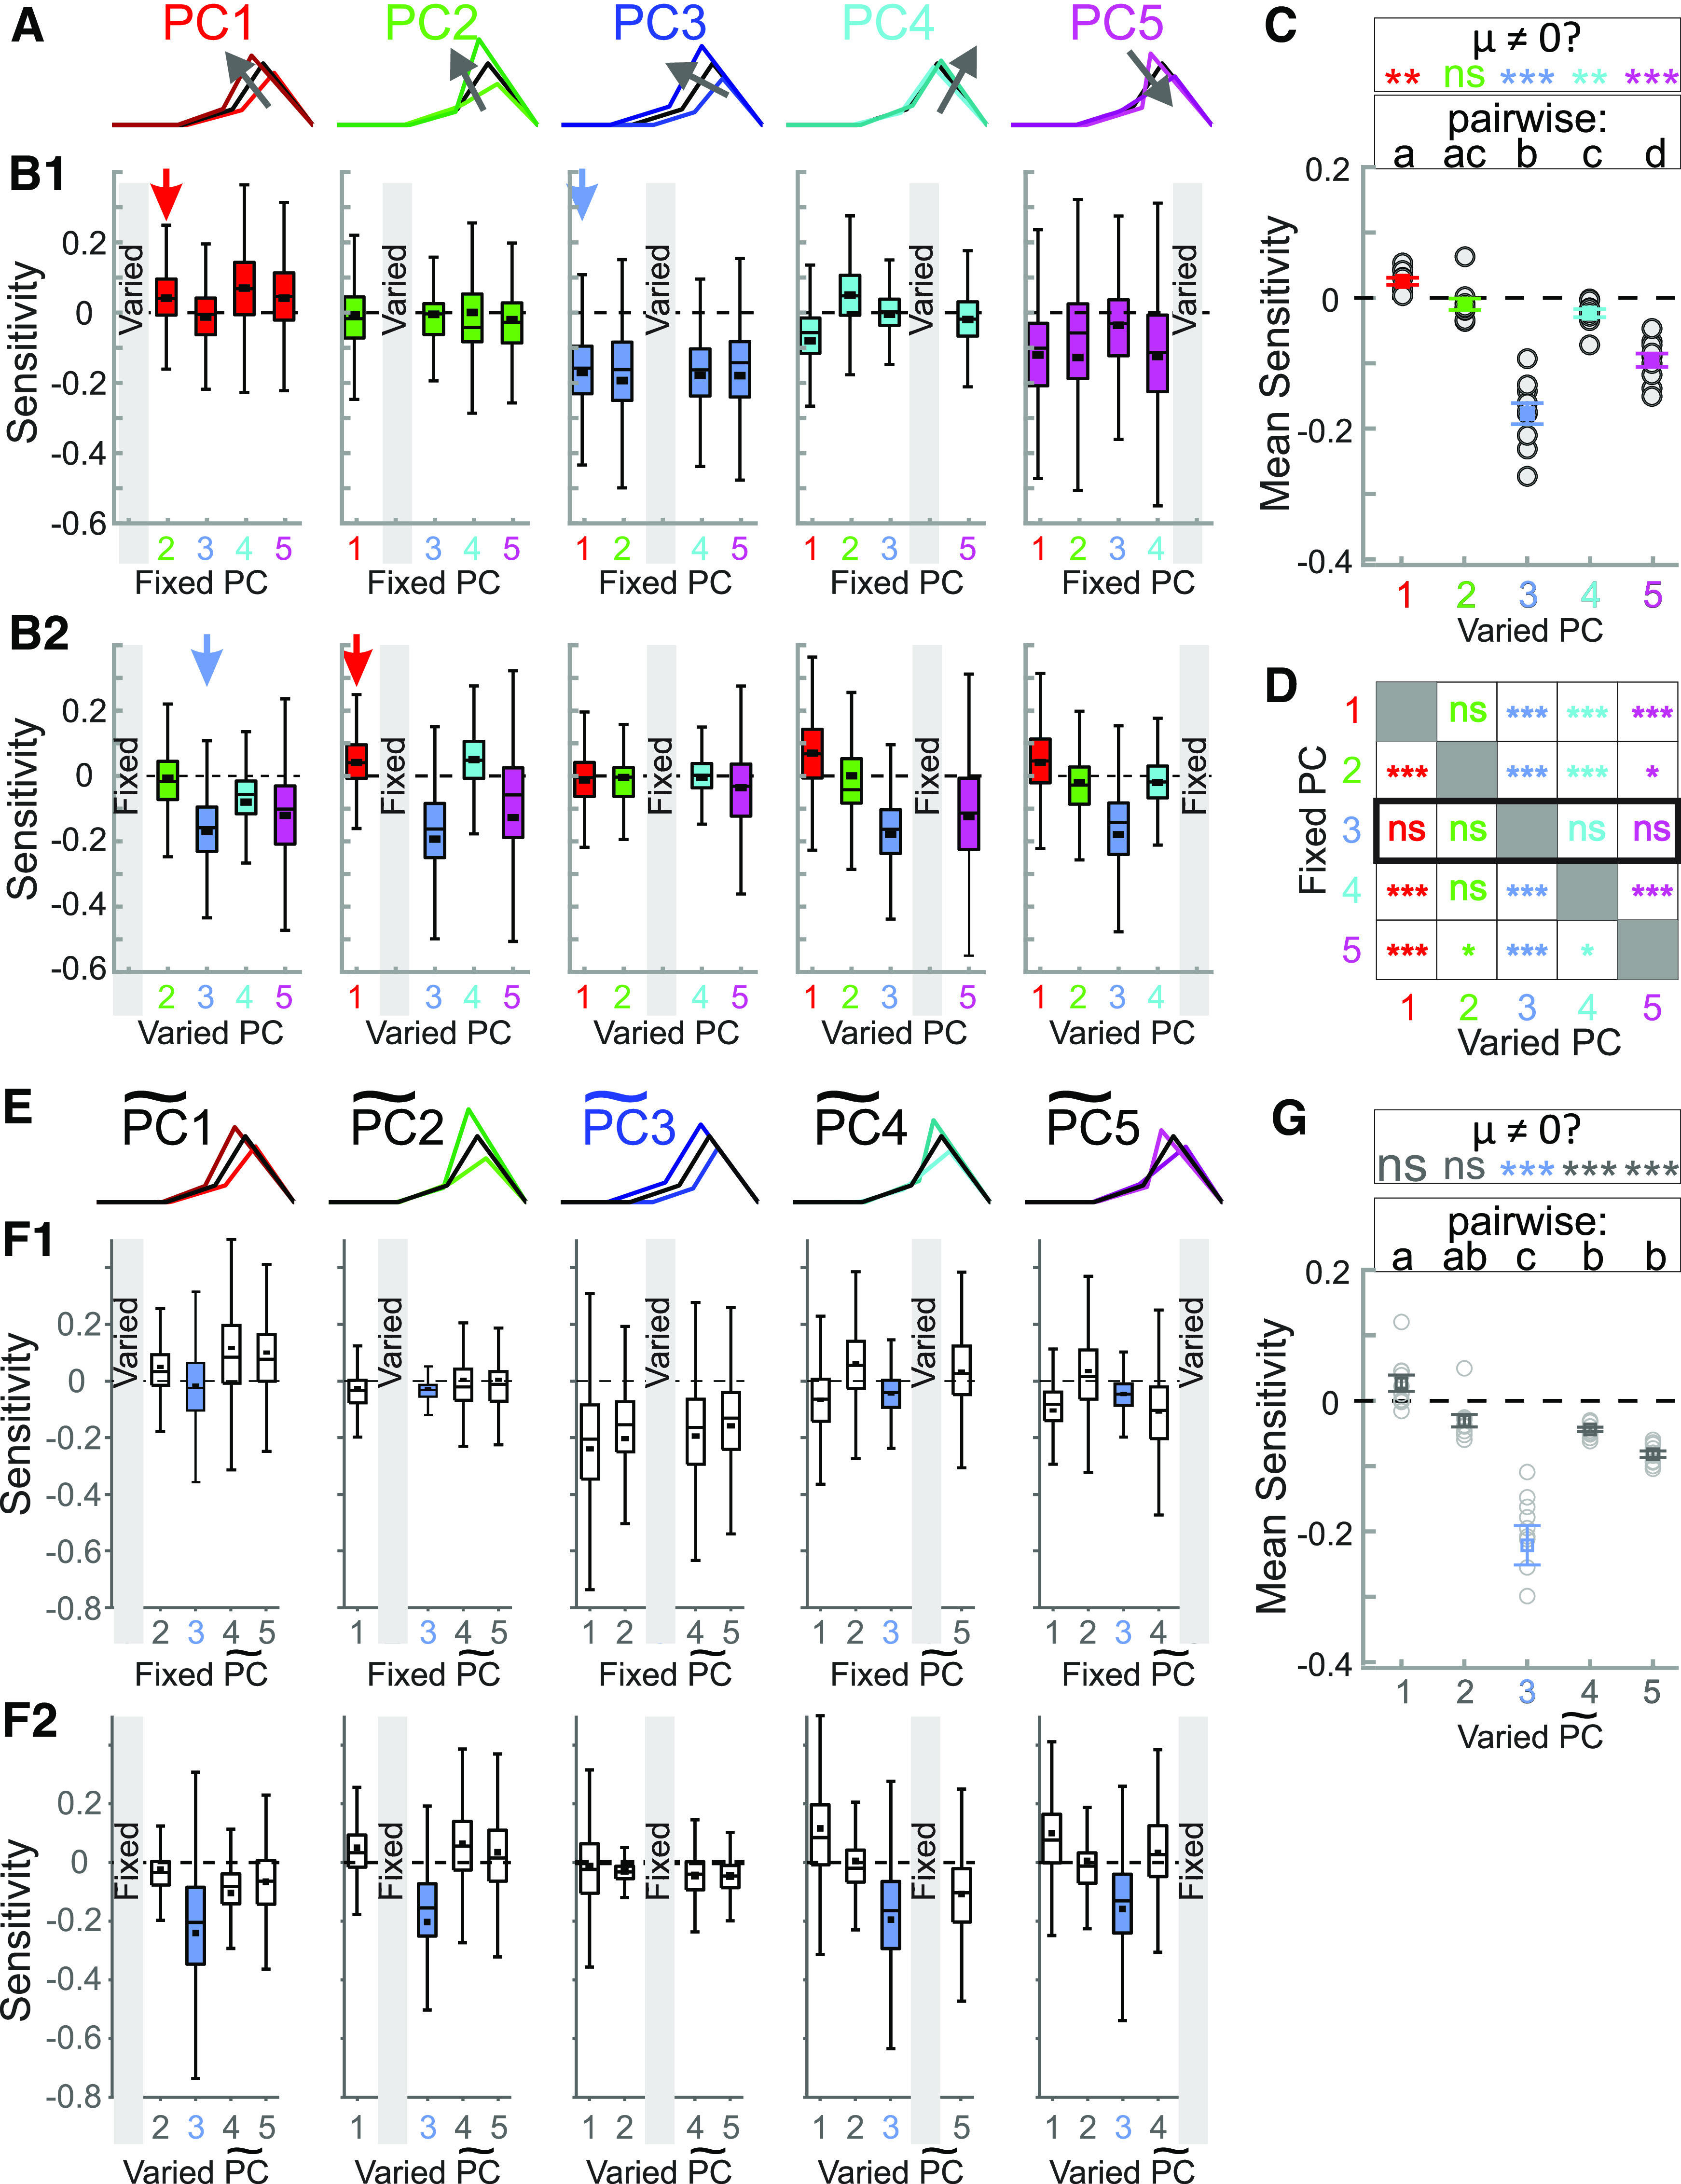
Varying synaptic waveform shape along each principal component while keeping another principal component constant. A, Graphical representation of how the shape of a representative synaptic waveform (black) changes when synaptic parameters are shifted by 25% in the direction of each principal component (in the direction of the arrow). B1, Sensitivity of LP burst onset latency to changing the principal component along a single PC (marked by gray box in each panel) while a single other PC is kept constant (and the other three are not controlled). Examples of the process (marked by arrows) are shown in Figure 8C,D. In these panels, quartile plots are from data including every individual sensitivity value (200–500 data points) in each experiment (N = 10 animals). Black squares show mean values. B2, The same data as in B1, reorganized so that each panel shows data when a single PC (gray box) is kept constant while a single other PC is varied (and the other 3 are not controlled). The red and blue arrows point to the same data as they do in B1. C, Overall sensitivity of LP burst latency (Fig. 8) to changing the synaptic waveform along each PC, measured as an overall average of the values shown in panel B. In this graph, only the mean sensitivity values in each experiment are used as data points (N = 10). These sensitivities were significantly different (one-way RM-ANOVA p < 0.001). Different letters (a–d) indicate p < 0.01 with post hoc Tukey’s test; shared letters indicate p > 0.05. Asterisks indicate post hoc analysis indicating whether the mean value (μ) ≠ 0, **p < 0.001, ***p < 0.0001. D, Statistical summary of panel A data, indicating how varying one PC, while keeping another PC constant (and not controlling others), would produce a change in LP burst latency. Asterisks indicate post hoc analysis indicating whether μ ≠ 0, *p < 0.01, **p < 0.001, ***p < 0.0001. E, The direction of DC is marked as for visual comparison with PC3 in panels A–D. The other s are roughly (but not exactly) in similar directions as the corresponding PCs of A–D. F1, Sensitivity of LP burst onset latency to changing the principal component along a single (marked by gray box in each panel) while a single other is kept constant (and the other three are not controlled). Data are the same as in B. Black squares show mean values. F2, The same data as in F1, reorganized so that each panel shows data when a single PC (gray box) is kept constant while a single other PC is varied (and the other 3 are not controlled). G, Overall sensitivity of LP burst latency to changing the synaptic waveform along each (as in panel F), measured as an overall average of the values shown in F. Notations the same as in C. See Extended Data Figure 9-1 for values of PCs and s.
