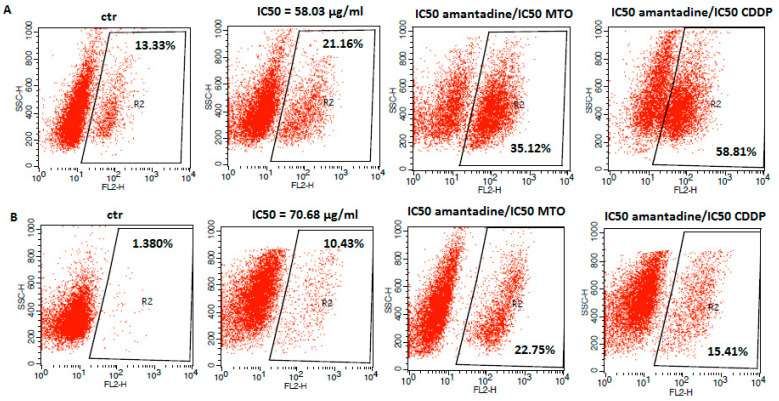
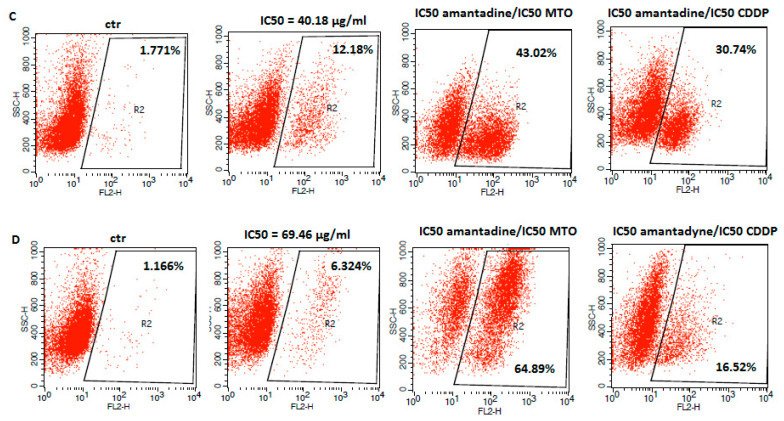
Figure 4.
Representative flow cytometry dot plot graphs of A375 (A), SK-MEL28 (B), FM55P (C) and FM55M2 (D) melanoma cell lines after the treatment with a medium (ctr) and amantadine alone or in combination with CDDP and MTO at their IC50 concentrations for 72 h. Region R2 included apoptotic cells with active caspase-3.


