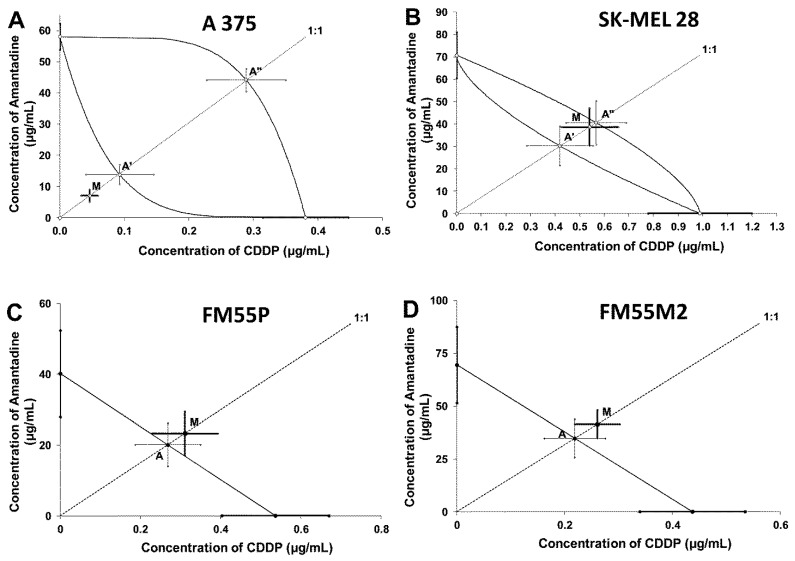
Figure 9.
Isobolograms display additive interaction between amantadine and CDDP with respect to their anti-proliferative effects on A375 (A), SK-MEL28 (B), FM55P (C) and FM55M2 (D) melanoma cell lines measured in vitro by the MTT assay. The IC50 ± S.E.M. (as the error bars) for amantadine and CDDP are plotted on the X- and Y-axes, respectively. The points A, A′ and A″ depict the theoretically calculated IC50add values (±S.E.M.). The point M on each graph represents the experimentally-derived IC50exp value (±S.E.M.) for the mixture, which produced a 50% anti-viabilitive effect in the melanoma cell lines. Although point M is placed below the point A″ for the A357 cell line (A), the two-drug combination produced additivity in the MTT assay. For the SK-MEL28 cell line, the point M is placed between both points A′ and A″ within the area of additivity indicating additive interaction between amantadine and CDDP (B). In the case of the FM55P (C) and FM55M2 (D) cell lines, point M is placed slightly above point A, indicating additive interaction for amantadine with CDDP in the MTT assay.

