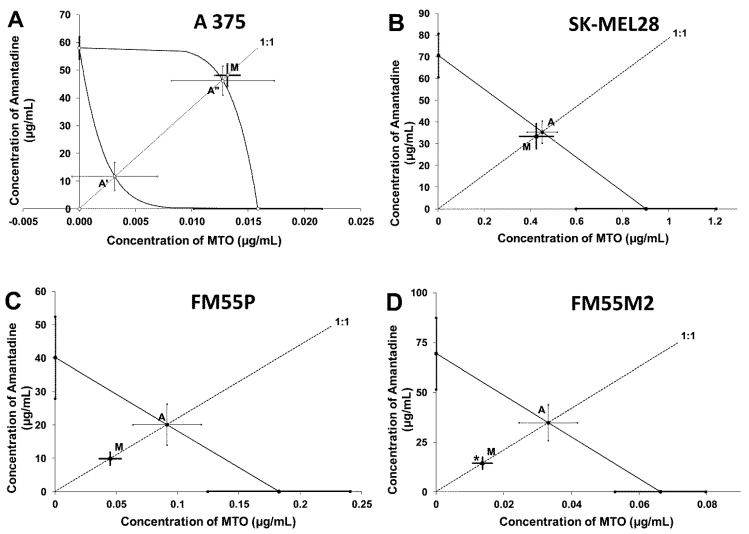
Figure 10.
Isobolograms display additive and synergistic interactions between amantadine and mitoxantrone (MTO) with respect to their anti-proliferative effects on A375 (A), SK-MEL28 (B), FM55P (C) and FM55M2 (D) melanoma cell lines measured in vitro by the MTT assay. The IC50 ± S.E.M. for amantadine and MTO are plotted on the X- and Y-axes, respectively. The points A, A′ and A″ depict the theoretically calculated IC50add values (±S.E.M.). The point M on each graph represents the experimentally-derived IC50exp value (±S.E.M.) for the mixture, which produced a 50% anti-proliferative effect in the malignant melanoma cell lines. * p < 0.05 vs. the respective IC50add value (Student’s t-test with Welch correction). Point M is placed slightly above point A′ for the A357 cell line (A) indicating additivity between amantadine and MTO in the MTT assay. For the SK-MEL28 cell line, point M is placed between slightly below point A indicating additive interaction between amantadine and MTO (B). For the FM55P cell line (C), point M is placed below point A, indicating additive interaction for amantadine with MTO in the MTT assay. For the FM55M2 cell line (D), point M is placed significantly below point A (* p < 0.05), illustrating synergistic interaction between amantadine and MTO in the MTT assay.

