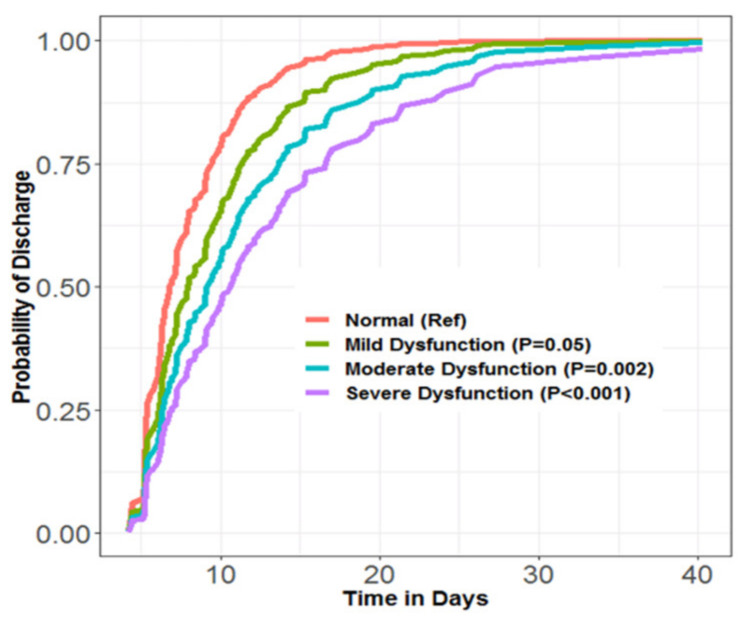
Figure 2.
Dose–response relationship between severity of performance abnormality during diastole and daily probability of discharge; mild dysfunction (green), moderate dysfunction (blue), severe dysfunction (purple), normal (red). Survival analyses performed using R programming environment. Estimates and CIs obtained using the “coxph” function. Lower (RR 0.54/95% CI 0.40–0.75) for those with diastolic dysfunction compared to those with normal performance during diastole in unadjusted analysis.

