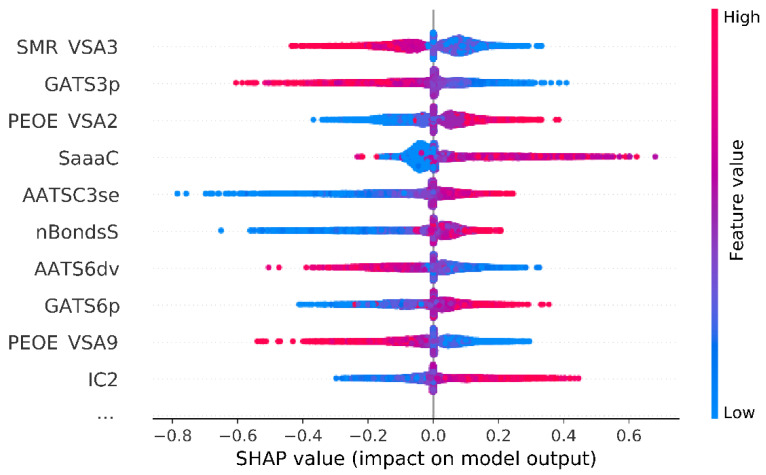
Figure 4.
Summary of SHAP analysis for 10 input variables with the overall highest impact on model predictions. SMR VSA3—MOE MR VSA Descriptor 3; GATS3p—Geary autocorrelation of lag 3 weighted by polarizability; PEOE VSA2—MOE Charge VSA Descriptor 2; SaaaC—sum of aaaC; AATSC3se—averaged and centered Moreau–Broto autocorrelation of lag 3 weighted by Sanderson EN; nBondsS—number of single bonds in non-kekulized structure; AATS6dv—averaged Moreau–Broto autocorrelation of lag 6 weighted by valence electrons; GATS6p—Geary coefficient of lag 6 weighted by polarizability; PEOE VSA9—MOE Charge VSA Descriptor 9; IC2—2-ordered neighborhood information content.

