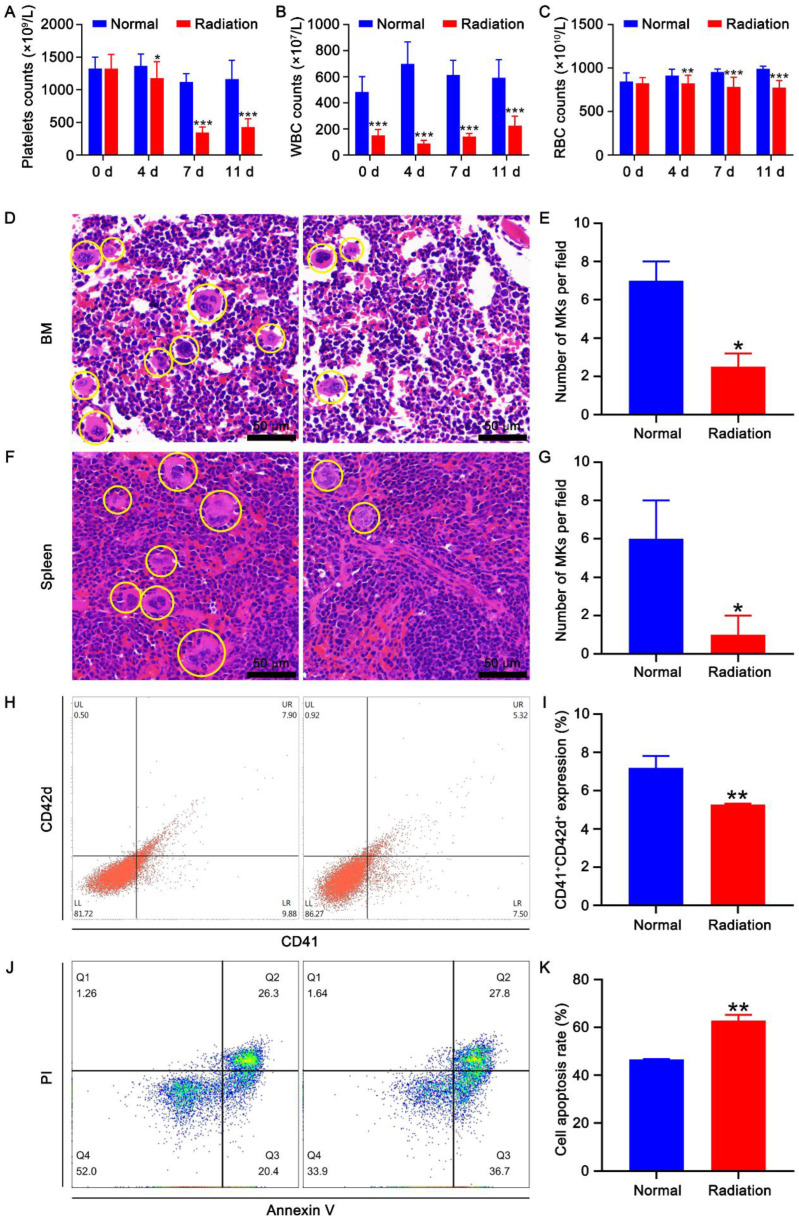
Figure 1.
Effect of irradiation on hematopoiesis. Peripheral platelet (A), WBC (B), and RBC (C) counts in mice at different time points after irradiation. Thirty-two mice divided into two groups (eight males and eight females in each group) were used. Data represent the mean ± SD of three independent experiments. * p < 0.05, ** p < 0.01, *** p < 0.001 vs. the normal group. H&E staining of BM (D) and spleen (F) in normal and irradiated mice. The histograms represent the number of megakaryocytes in the BM (E) and spleen (G) of normal and irradiated mice. Data represent the mean ± SD of three independent experiments. * p < 0.05 vs. the normal group. (H) Flow cytometry analysis of the expression of CD41 and CD42d in the BM cells of normal and irradiated mice. (I) The histogram illustrating the proportion of CD41 + CD42d + cells in each group. Data represent the mean ± SD of three independent experiments. ** p < 0.01 vs. the normal group. (J) Apoptosis analysis of the BM cells of normal and irradiated mice. (K) The histogram depicting the apoptosis rate of BM cells in each group. Data represent the mean ± SD of three independent experiments. ** p < 0.01 vs. the normal group.

