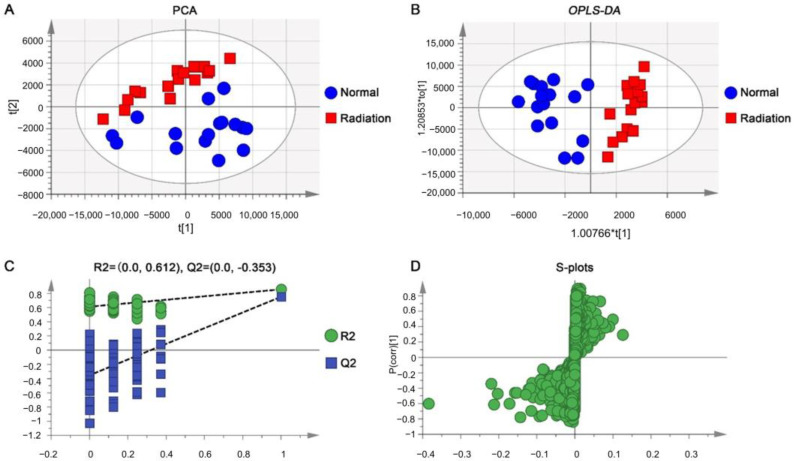
Figure 2.
Radiation-induced metabolomics phenotypes of mice in the ESI+ model. PCA score plot (A) and OPLS-DA score plot (B) for serum metabolic profiling of normal and irradiated mice, permutation validation (n = 100) (C), and S-plots (D) between normal and irradiated mice. * ESI+: Electrospray ionization source in positive-ion mode.

