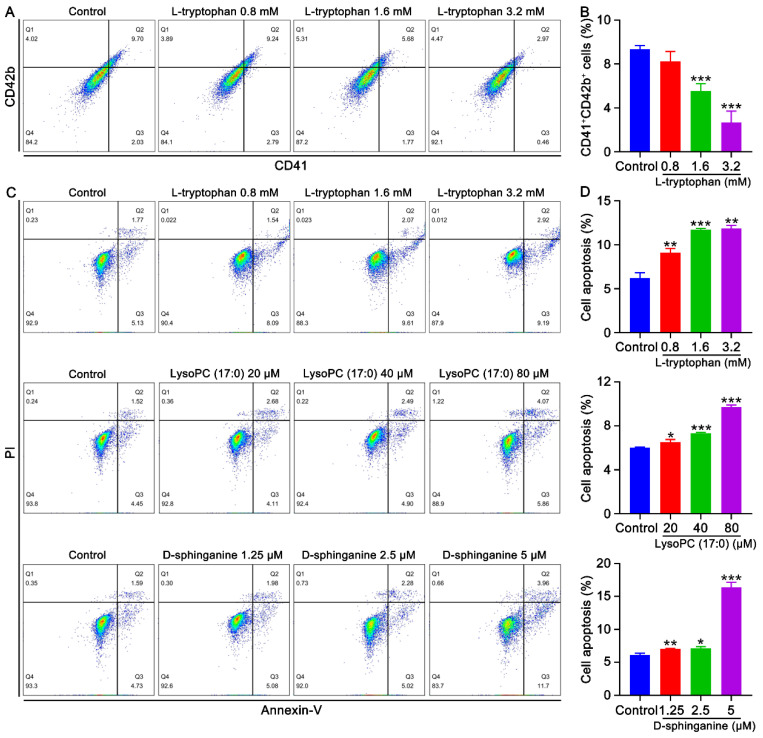
Figure 7.
Effects of metabolites on the differentiation and apoptosis of K562 cells. (A) Flow cytometry analysis of the expression of CD41 and CD42b after the treatment of K562 cells with different concentrations (0.8, 1.6, and 3.2 mM) of L-tryptophan for 6 days. (B) The histogram represents the proportion of CD41 + CD42b + cells in the control and L-tryptophan-treated groups. Data represent the mean ± SD of three independent experiments. *** p < 0.001 vs. the control group. (C) Apoptosis analysis of K562 cells treated with different concentrations of L-tryptophan (0.8, 1.6, and 3.2 mM), LysoPC (17:0) (20, 40, and 80 μM), and D-sphinganine (1.25, 2.5 and 5 μM) for 6 days. (D) The histogram represents the apoptosis rate of each group. Data represent the mean ± SD of three independent experiments. * p < 0.05, ** p < 0.01, *** p < 0.001 vs. the control group.

