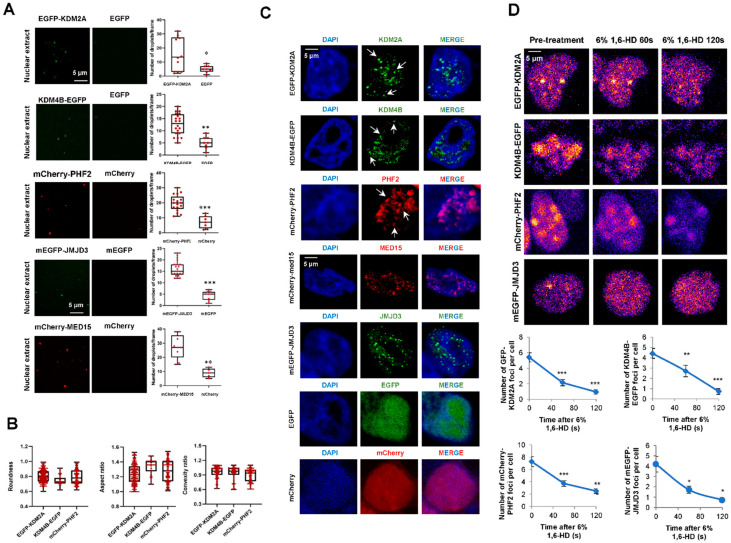
Figure 4.
JMJC-KDMs undergo LLPS in vitro and inside the cell. (A) EGFP-KDM2A, KDM4B-EGFP, mCherry-PHF2, EGFP-JMJD3, mCherry-MED15, EGFP, and mCherry proteins were analyzed using droplet-formation assays in nuclear extracts at room temperature in the presence of 150 mM NaCl. Quantification of the droplets is displayed on the right. Data are the mean ± SEM. * p < 0.05, ** p < 0.01 and *** p < 0.001 (Student’s t-test). Droplets in 5 fields from three biologically independent experiments were quantified. Scale bar, 5 μm. (B) Boxplots represent the roundness, convexity, and aspect ratio features of the fluorescent-tagged KDMs droplets. Data are the mean ± SEM. Quantifications correspond to droplets in 5 fields from three biologically independent experiments for each protein. (C) Confocal microscopy images of HEK293T cells transfected with EGFP-KDM2A, KDM4B-EGFP, mCherry-PHF2, EGFP-JMJD3, mCherry-MED15, EGFP, or mCherry and visualized with the fluorescence tag and DAPI to stain the DNA. Images are representative of 3 biologically independent experiments. Scale bar, 5 μm. (D) HEK293T cells were transfected with 0.05 ug plasmid encoding EGFP-KDM2A, KDM4B-EGFP, mCherry-PHF2, or EGFP-JMJD3; they were treated with 6% 1,6-Hexanediol for 5 min and imaged at 60 and 120 s. Nuclei were visualized with DAPI (blue). Quantification of the nuclear puncta displayed per cell along the treatment is shown on the right. Data are the mean ± SEM. * p < 0.05, ** p < 0.01; *** p < 0.001 (Student’s t-test). n = 30 transfected cells were quantified; Images are representative of three biologically independent experiments. Scale bar, 5 μm.

