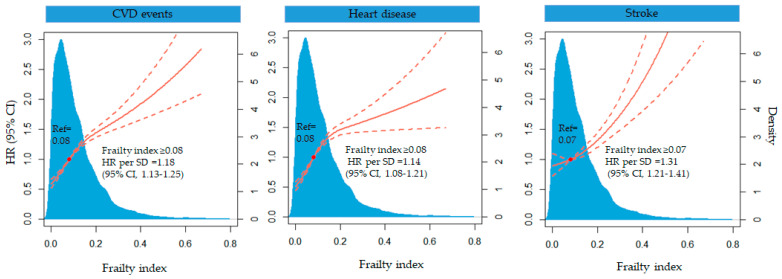
Figure 2.
Multivariable-adjusted HR for CVD, heart disease and stroke events according to levels of frailty index. The solid red line is the multivariate adjusted hazard ratios, and the dashed red line is the 95% CI from a restricted cubic spline model with three knots at the 10th, 50th and 90th centiles. Model was adjusted for age, gender, educational level, marital status, residence, smoking status, drinking status, hypertension, diabetes mellitus, dyslipidemia, use of antihypertensive medications, antidiabetic medications and lipid-lowering therapy, BMI, SBP and DBP.

