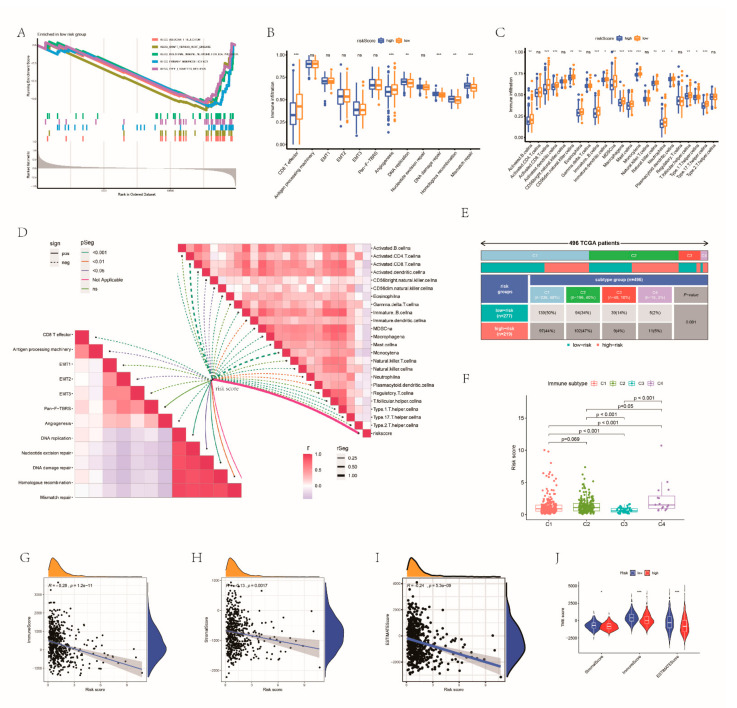
Figure 6.
Estimation of TME on the base of the RRGs GSEA of low RRG score group (A). The ssGSEA score and immune infiltration score of the two groups (B,C). (D) The association between different immune cells and risk score and the association between risk score as well as classical biological pathway score. (E) Immune subtype classification of each risk group in 496 TCGA patients. (F) The risk scores of 4 immune subtypes. The relationships between RRG score and stromal cells (G), immune cells (H) and estimated score (I). (J) Comparison of the TME score between the RRG clusters. * p < 0.05; ** p < 0.01; *** p < 0.001; ns, not significant.

