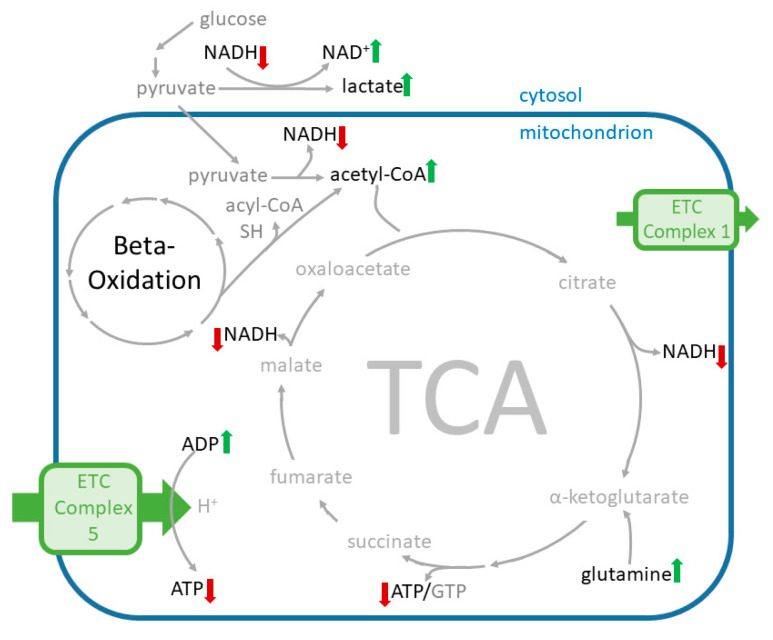
Figure 6.
Scheme of the affected metabolites and pathways in cana-treated HUVECs. Metabolite levels significantly elevated by cana (100 µM) and changed in the same direction by cana (10 µM) are marked with a green up-arrow, metabolite levels lowered by cana (100 µM) are marked with a red down-arrow.

