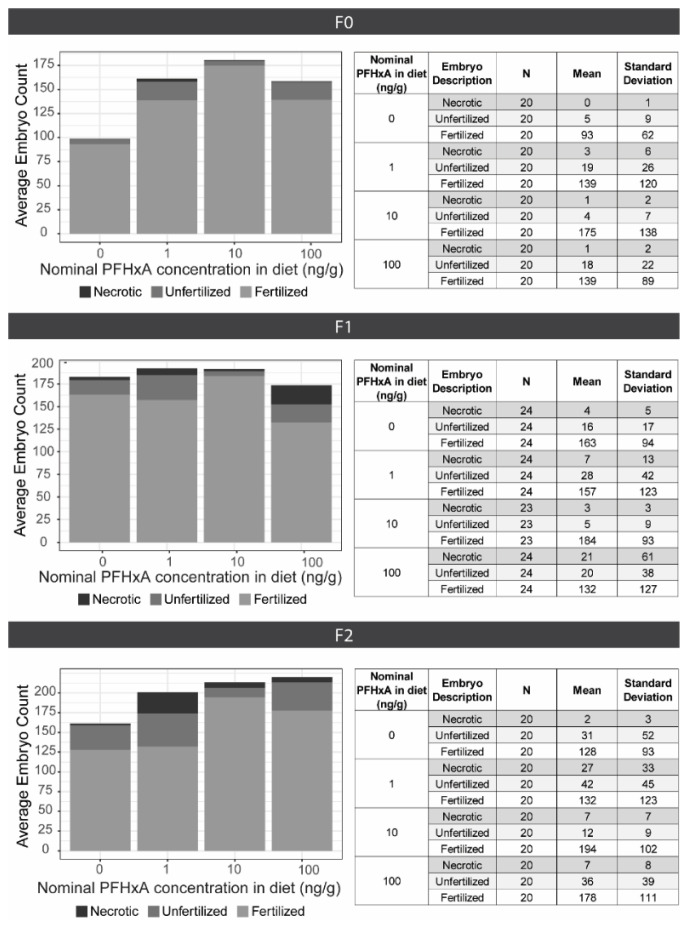
Figure 3.
Fecundity Assessments. 4 groups of 3 male and 2 female zebrafish were spawned for 5–6 consecutive spawning events per generation (top: F0, middle: F1, bottom: F2). The average embryo counts are plotted on the left, including necrotic (black), unfertilized (dark grey), and fertilized (light grey) embryos for each exposure group (0, 1, 10, or 100 ng/g PFHxA added to the F0 diet). The tables on the right indicate the evaluated number of spawns (N), mean counts, and standard deviation.

