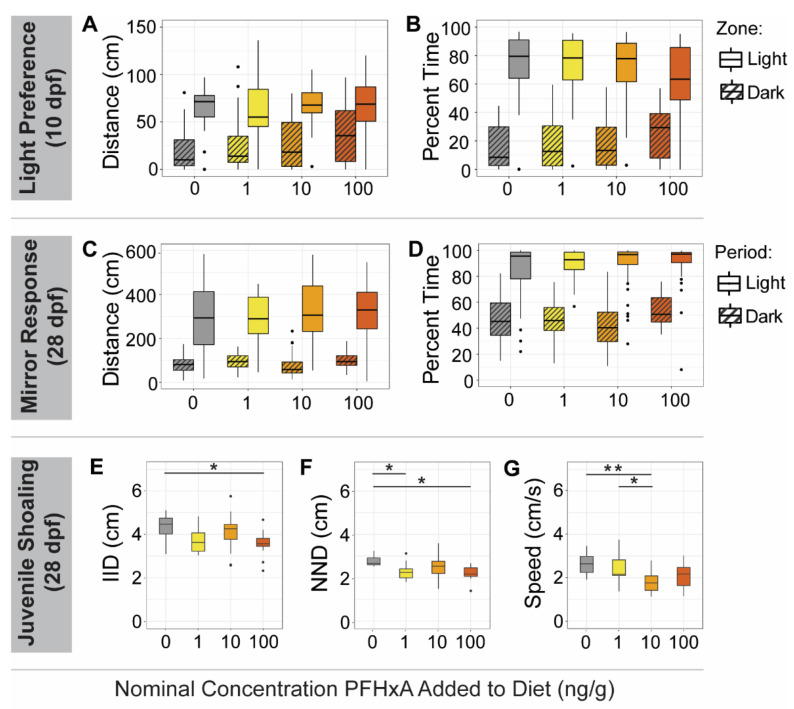
Figure 7.
F1 Juvenile Behavior Assays. F1 zebrafish exposure groups are indicated on the x-axes and by color (left to right, grey: 0 ng/g, yellow: 1 ng/g, orange: 10 ng/g, and red: 100 ng/g PFHxA added to the F0 diet). During the light/dark preference assay at 10 dpf, no significant differences in total distance swam (A) or percent time spent (B) in the light or dark (striped boxes) assay zones were observed between exposure groups. In the mirror response assay at 28 dpf, no differences in distance traveled (C) or percent time spent (D) in the mirror zone during the light or dark periods (striped boxes) were noted. During the juvenile shoaling assay at 28 dpf, the average inter-individual distance (IID) of the 100 ng/g group was significantly lower than that of controls (E). Average nearest neighbor distance (NND) of the 1 and 100 ng/g groups were less than controls (F). Speed of the 10 ng/g group was significantly lower than that of controls (G). Significant differences between exposure groups are indicated on the plots (* p < 0.05; ** p < 0.005).

