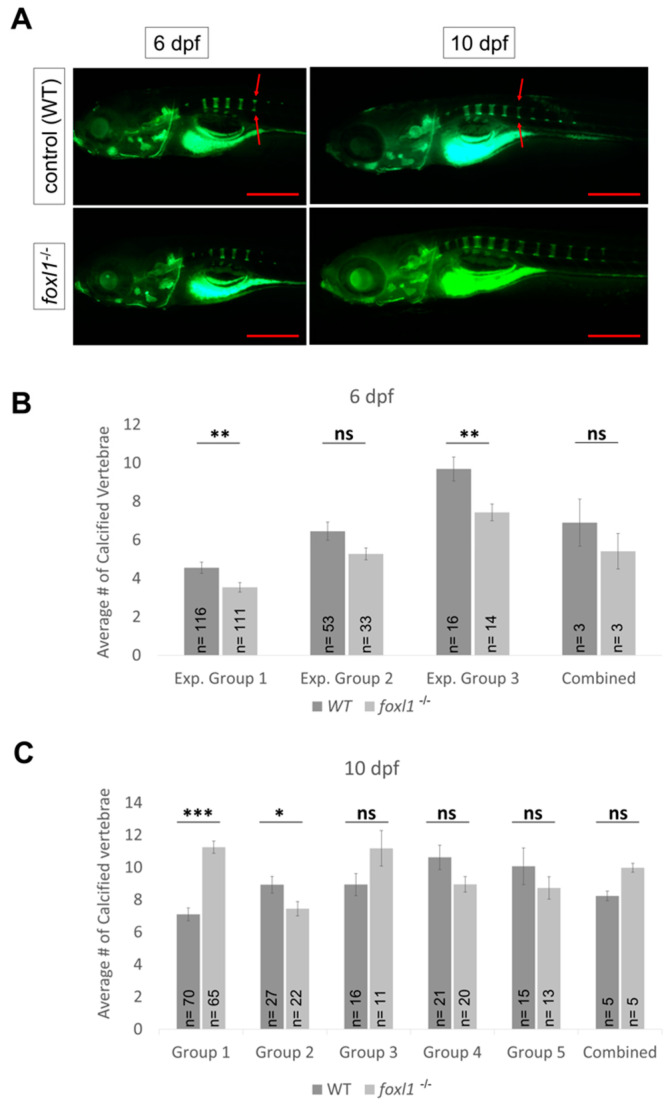
Figure 5.
Calcein staining illustrating the impact of foxl1 loss on axial skeletal development and calcification. (A) WT and foxl1-/- embryos at 6 and 10 dpf showing normal formation of the vertebrae in foxl1. (B,C) Experimental groups of calcein staining illustrating the variability in calcification of the zebrafish vertebrate between WT and foxl1 homozygotes at 6 and 10 dpf, respectively (* p < 0.05, ** p < 0.01, *** p < 0.001), showing an increased trend in number of calcified vertebrae in foxl1 mutants by 10 dpf. Total number of calcified vertebrae were counted by including both complete and partially calcified vertebrae [partially calcified vertebrae are indicated by disconnected primary and secondary centres of ossification (red arrows)]. Scale bars are 500 µm.

